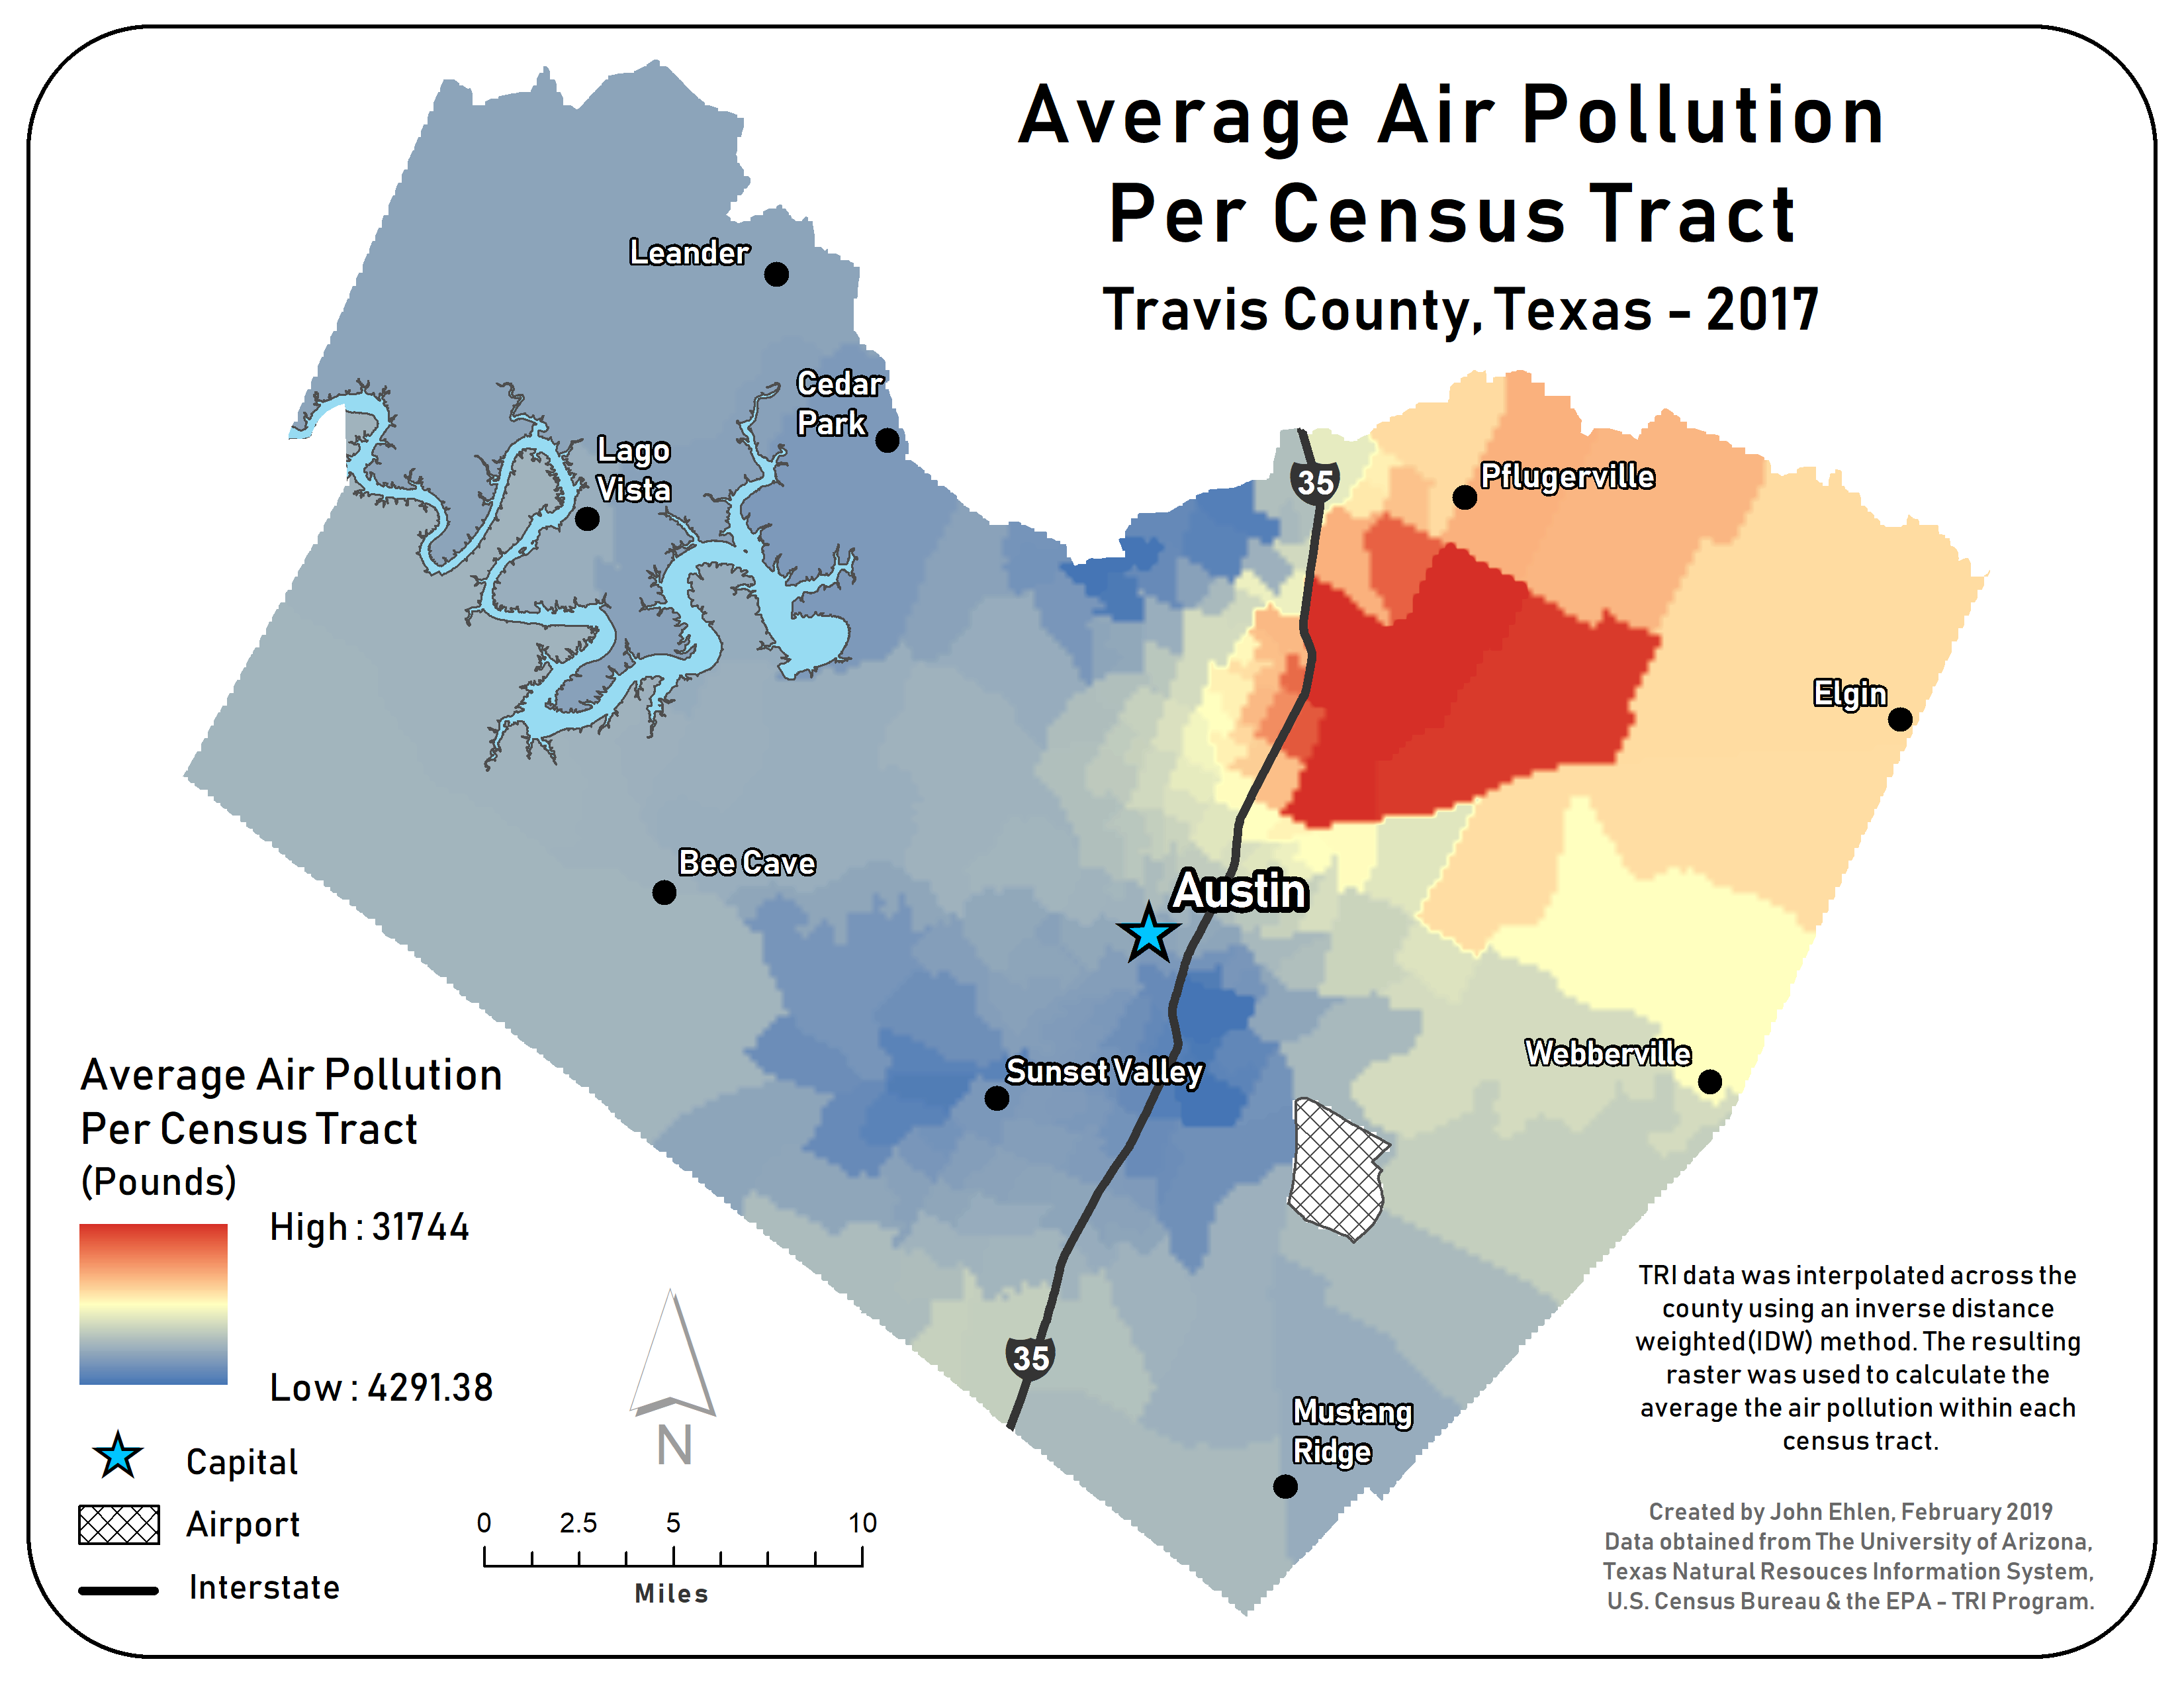
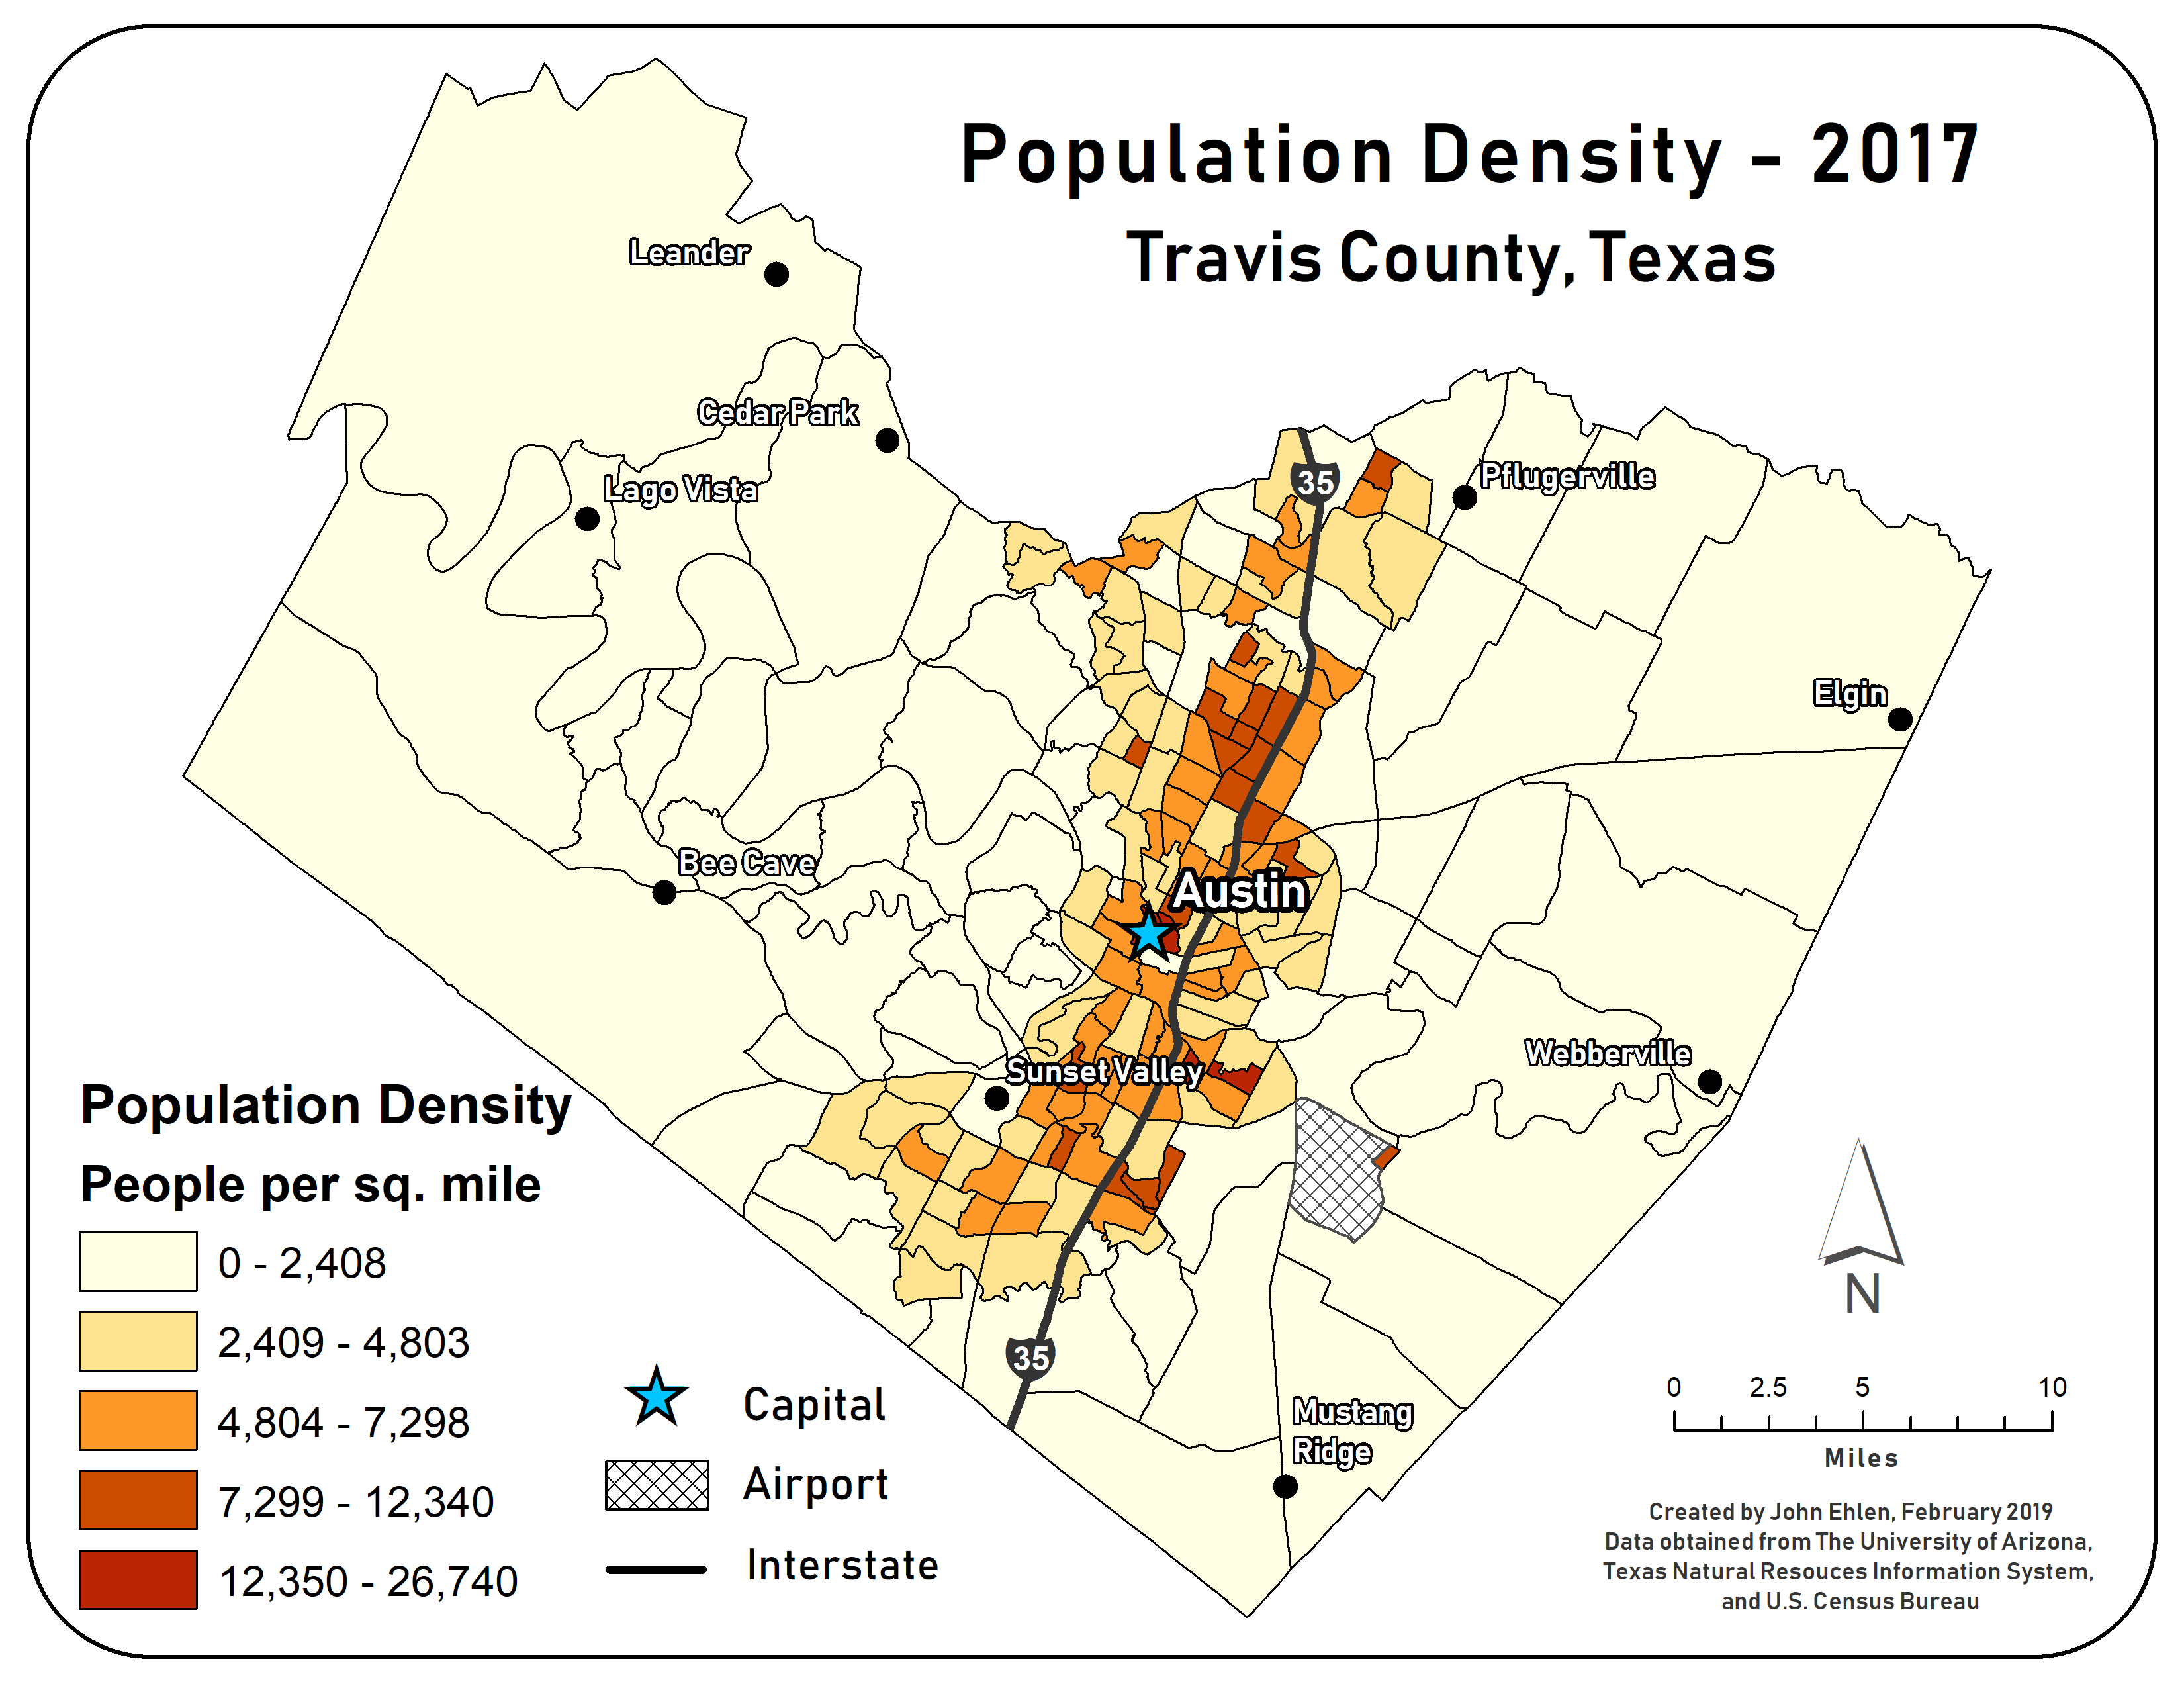
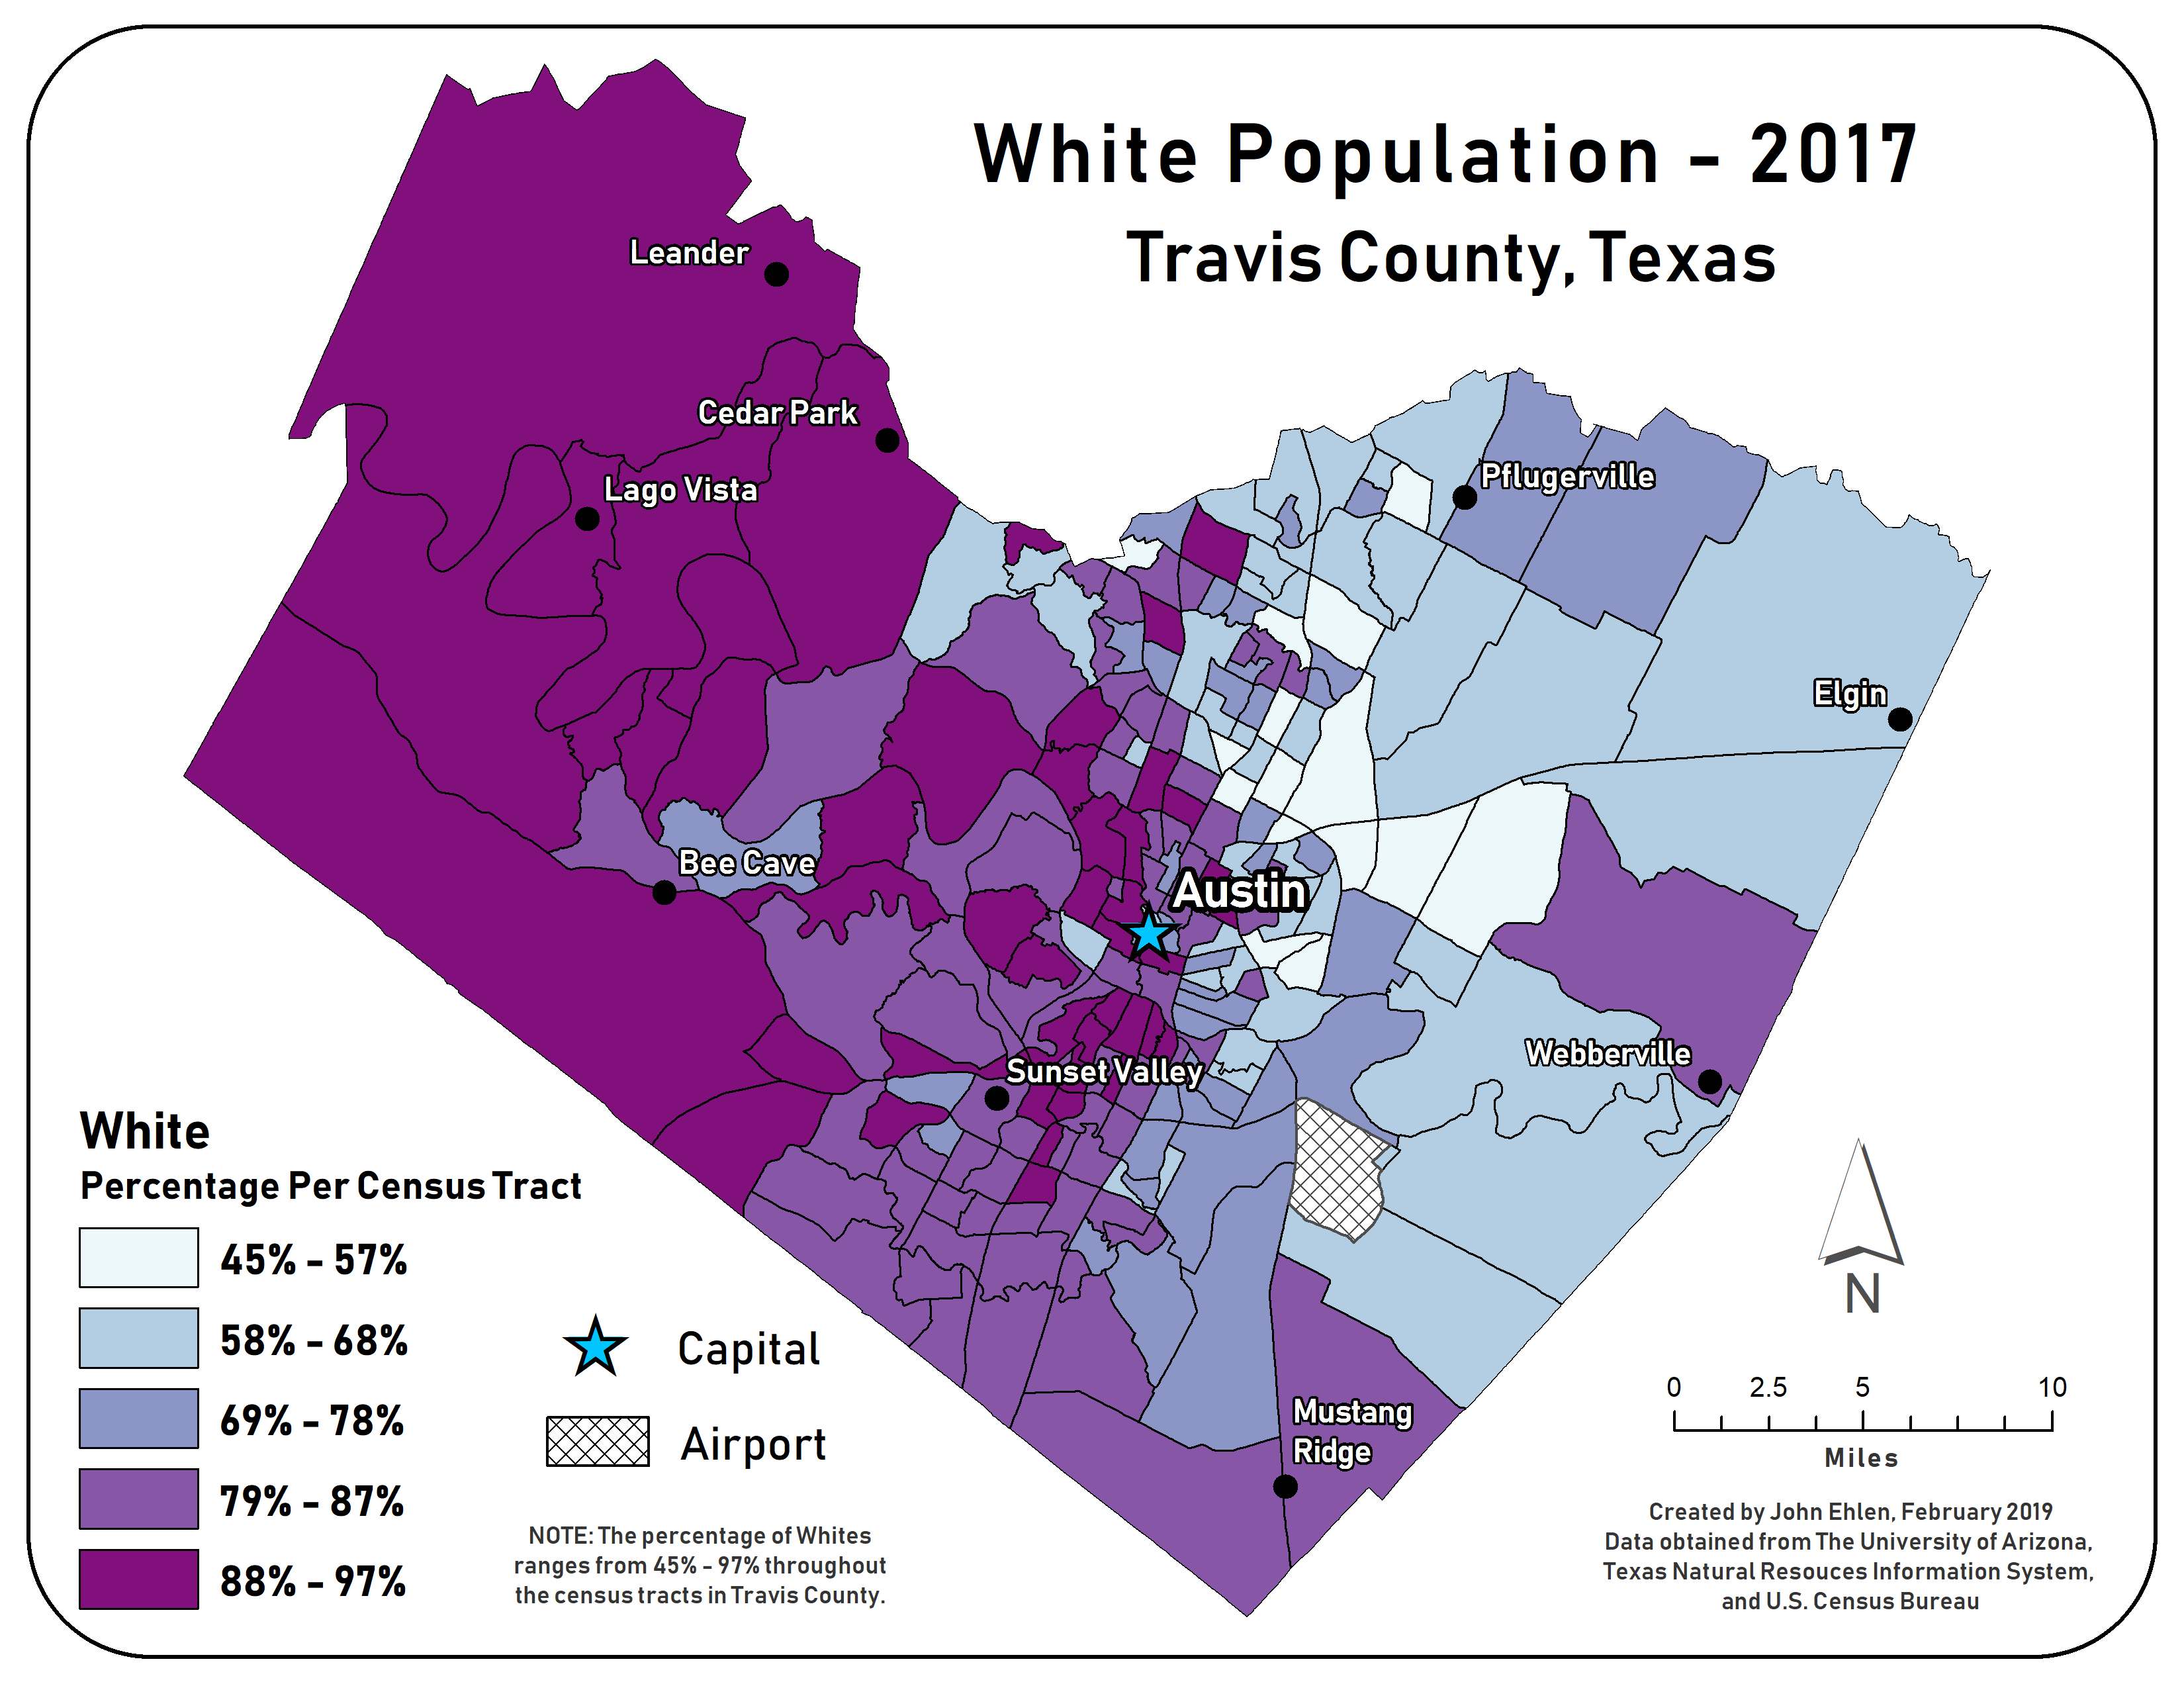
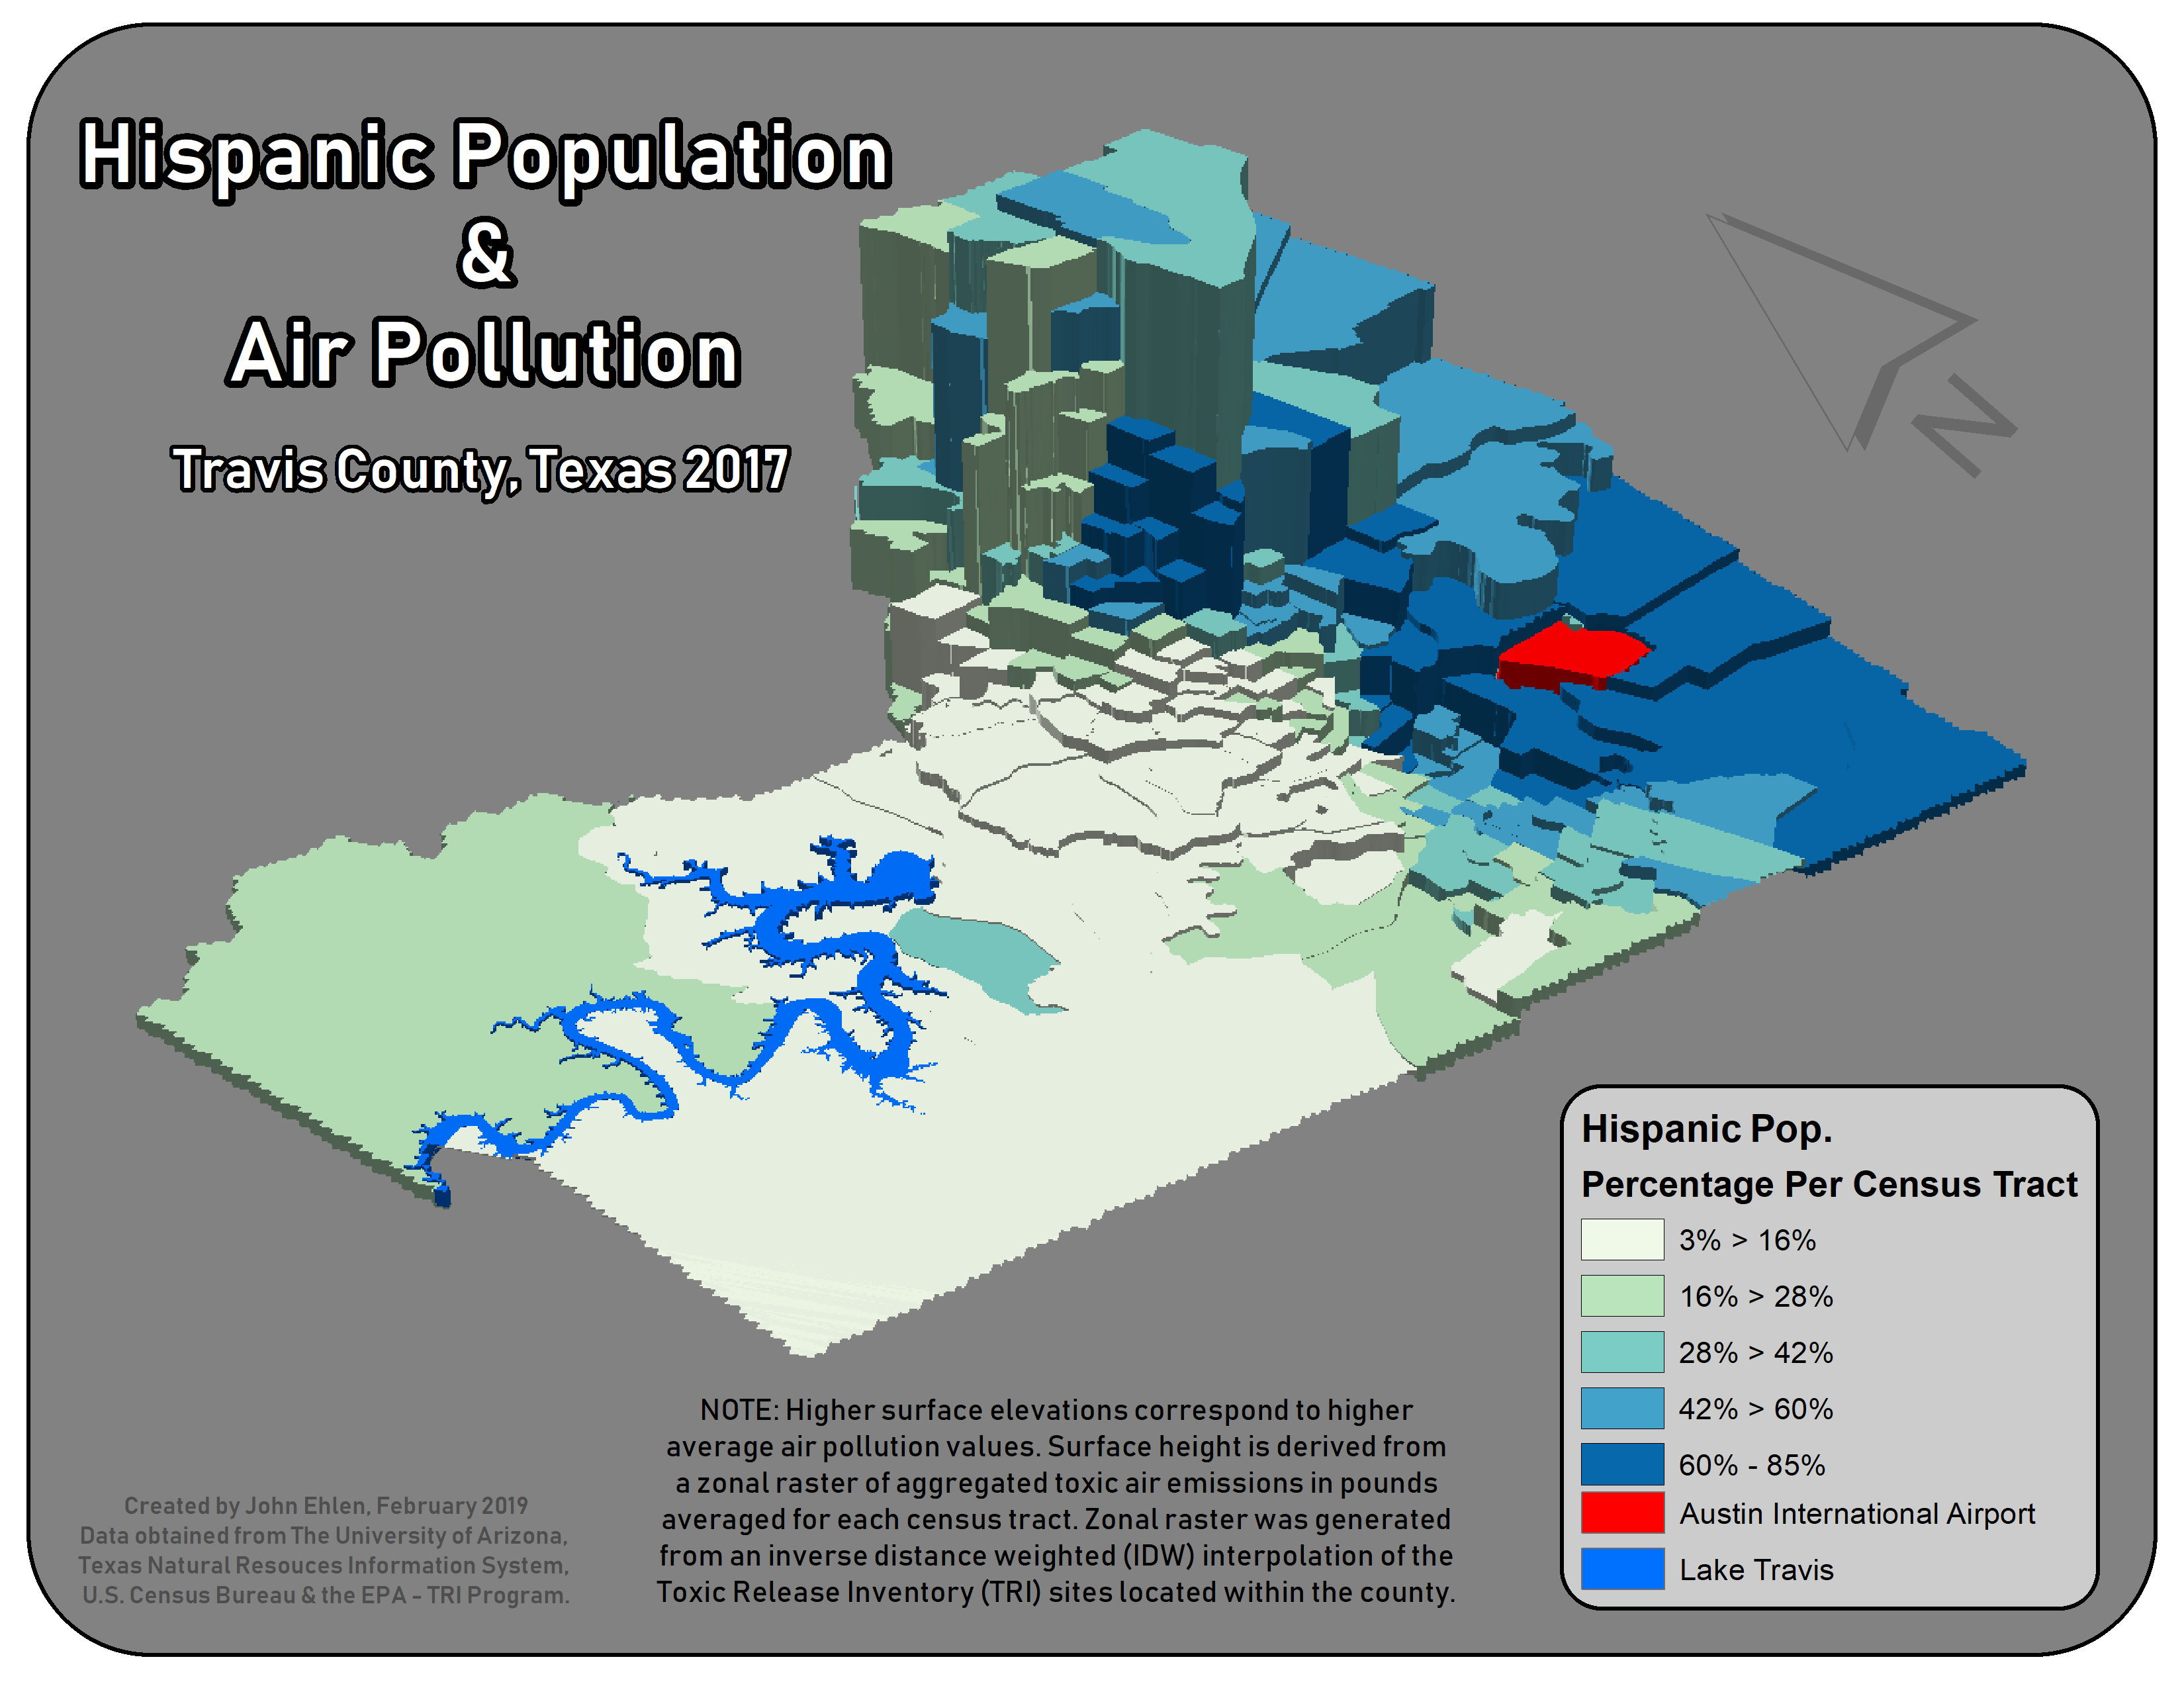
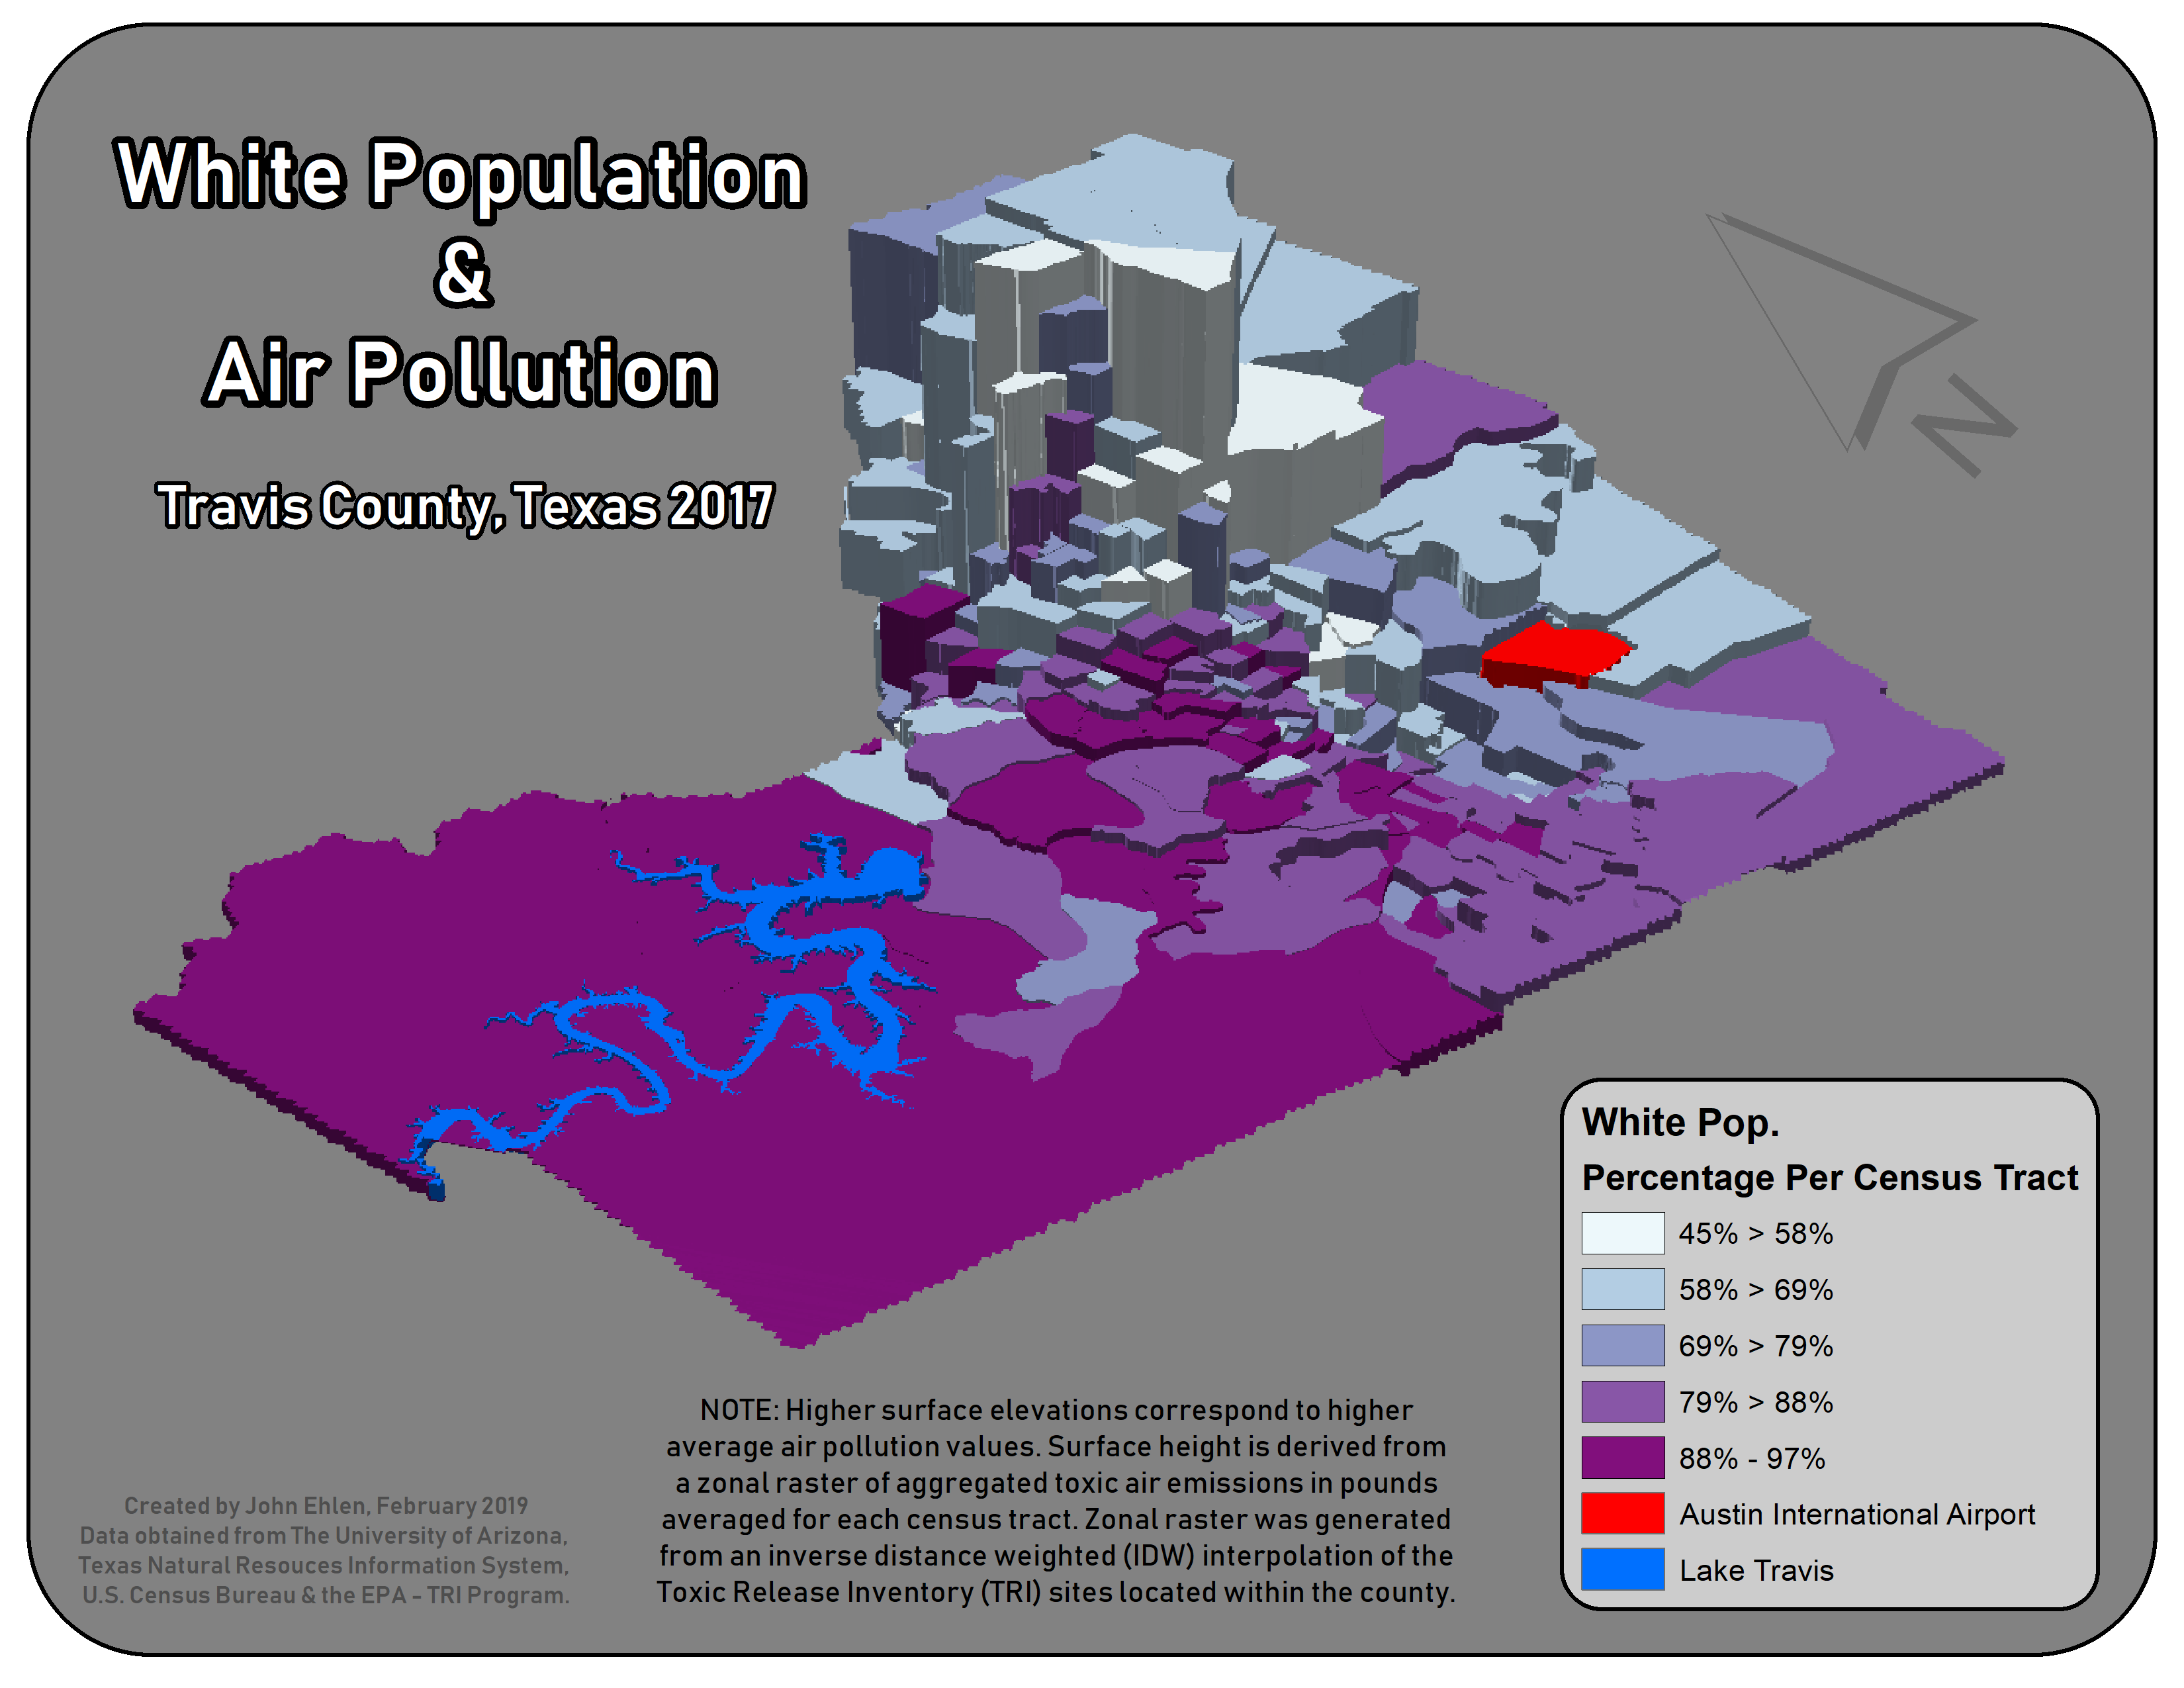
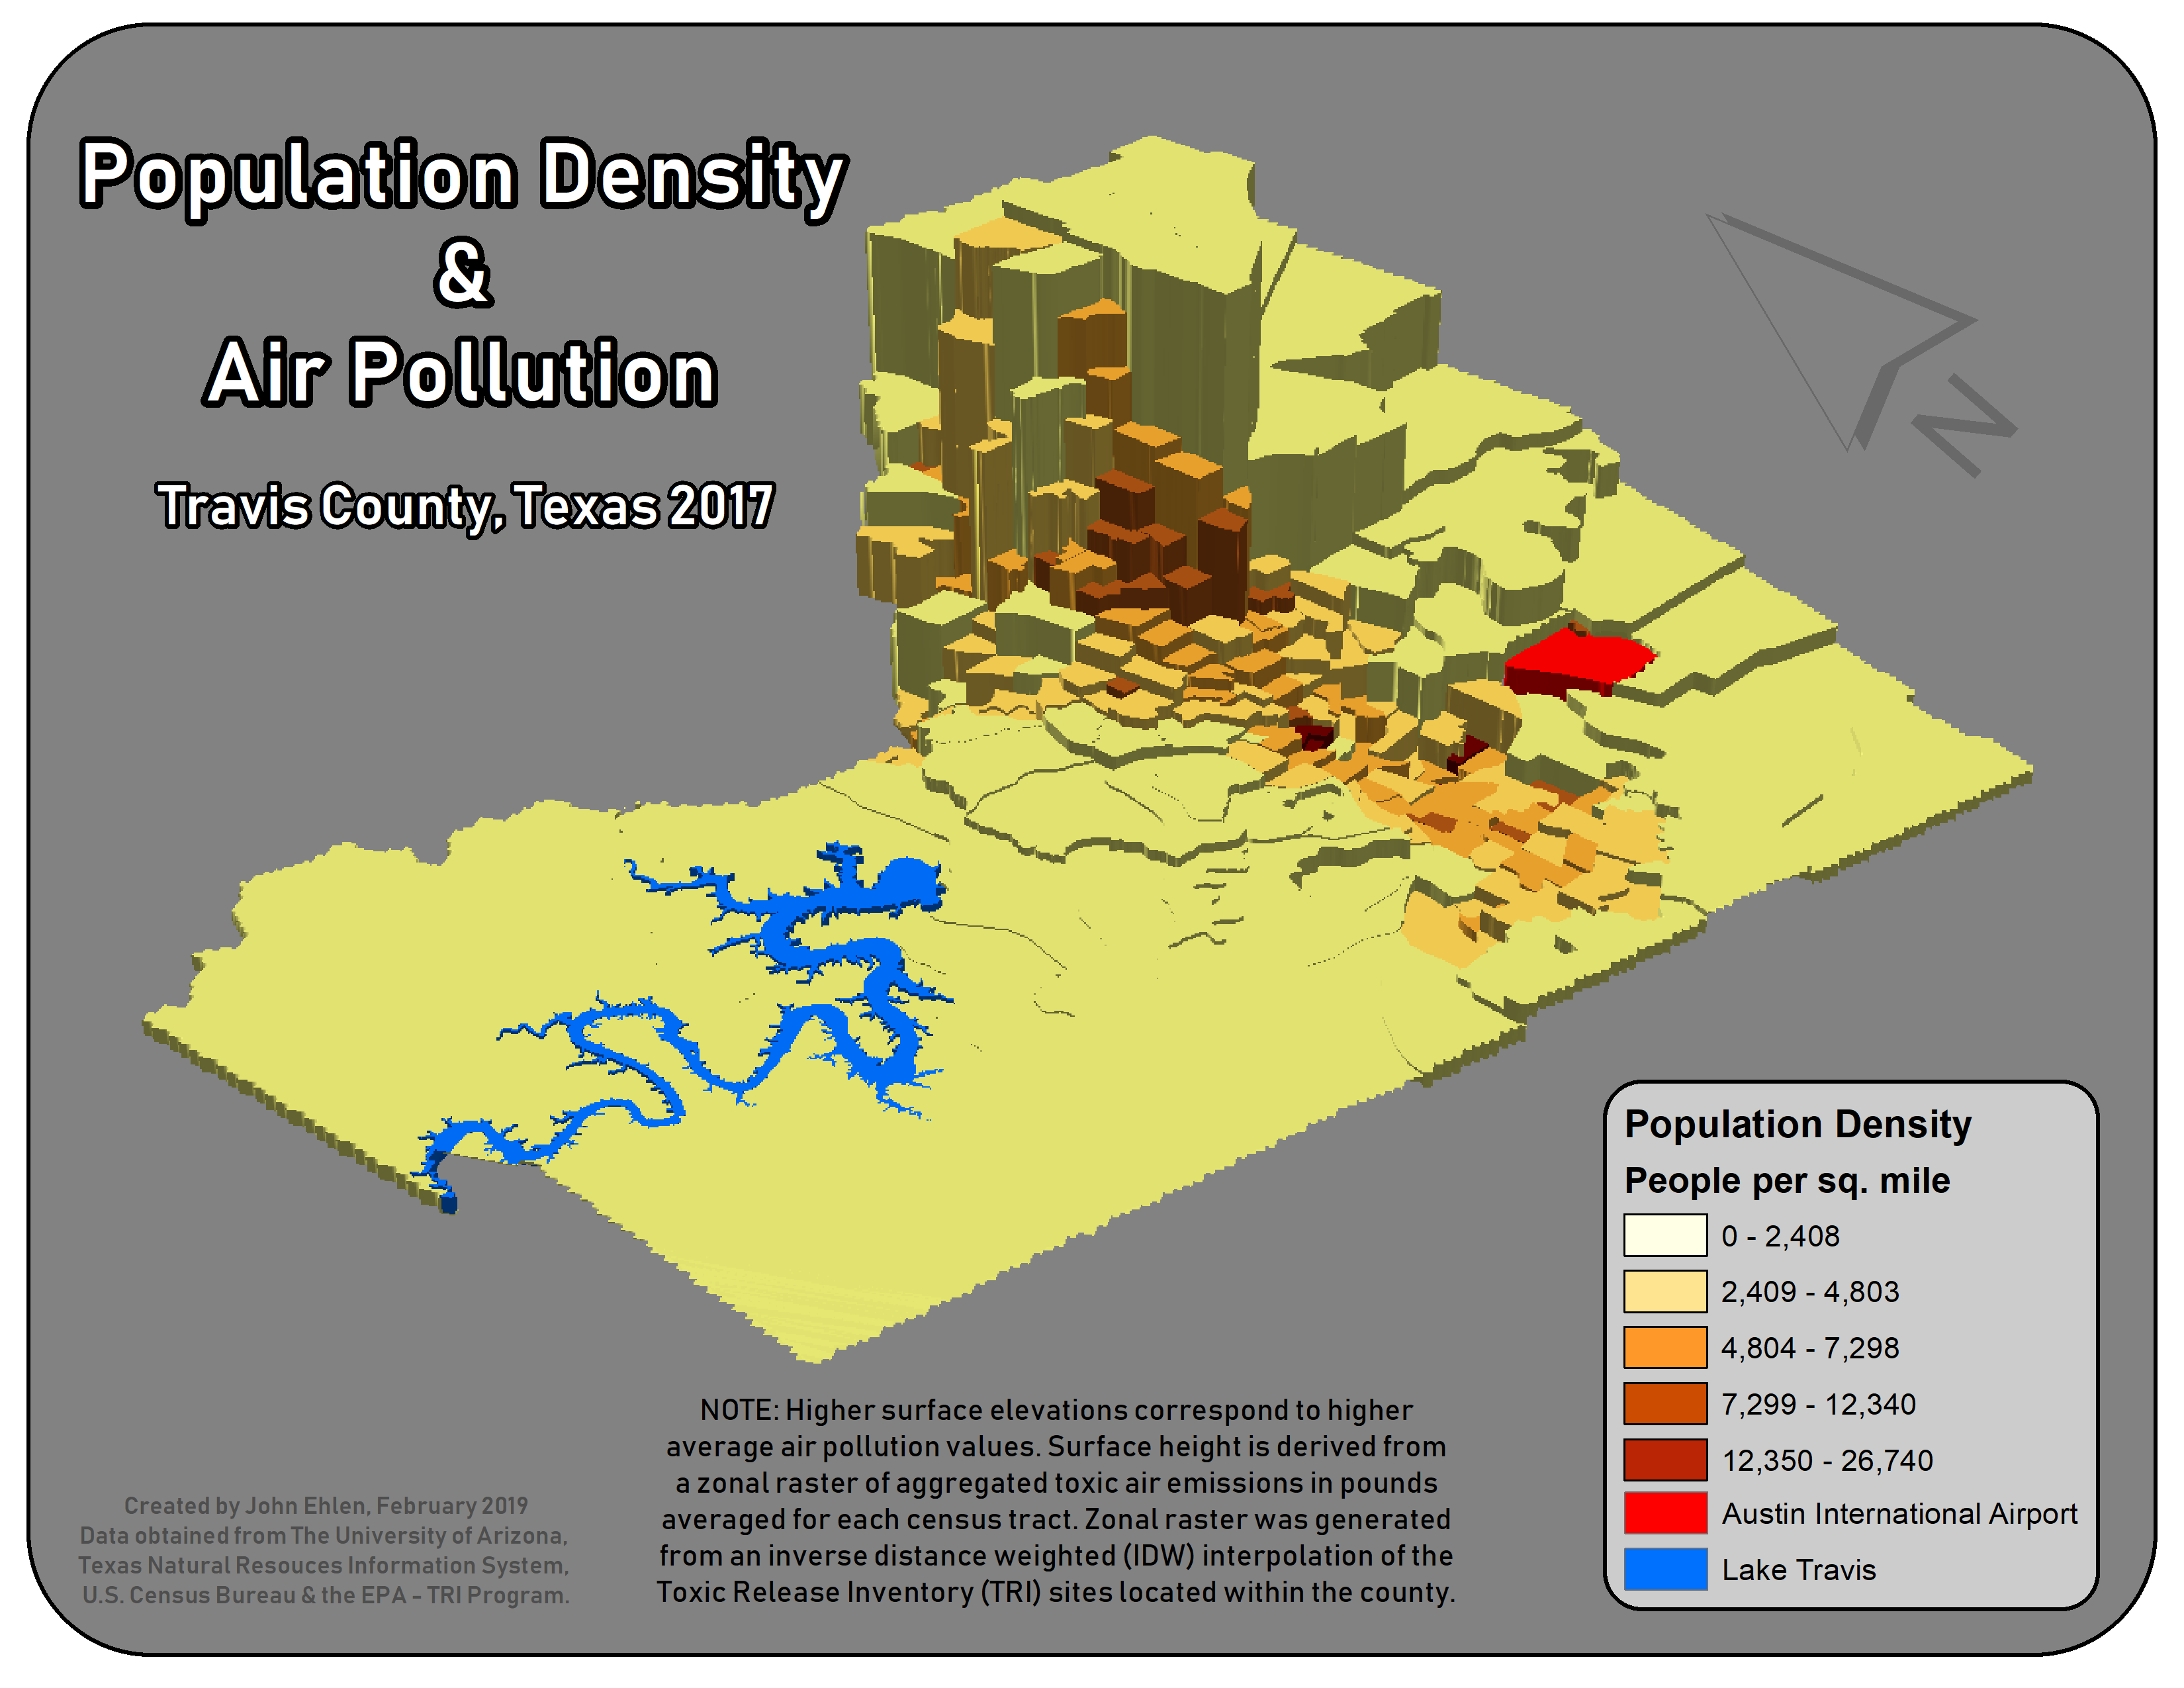
The goal of this project was to explore the spatial relationship between concentrations of minority populations and their proximity to major pollution sites identified from the Environmental Protection Agenc’s Toxic Release Inventory Data.
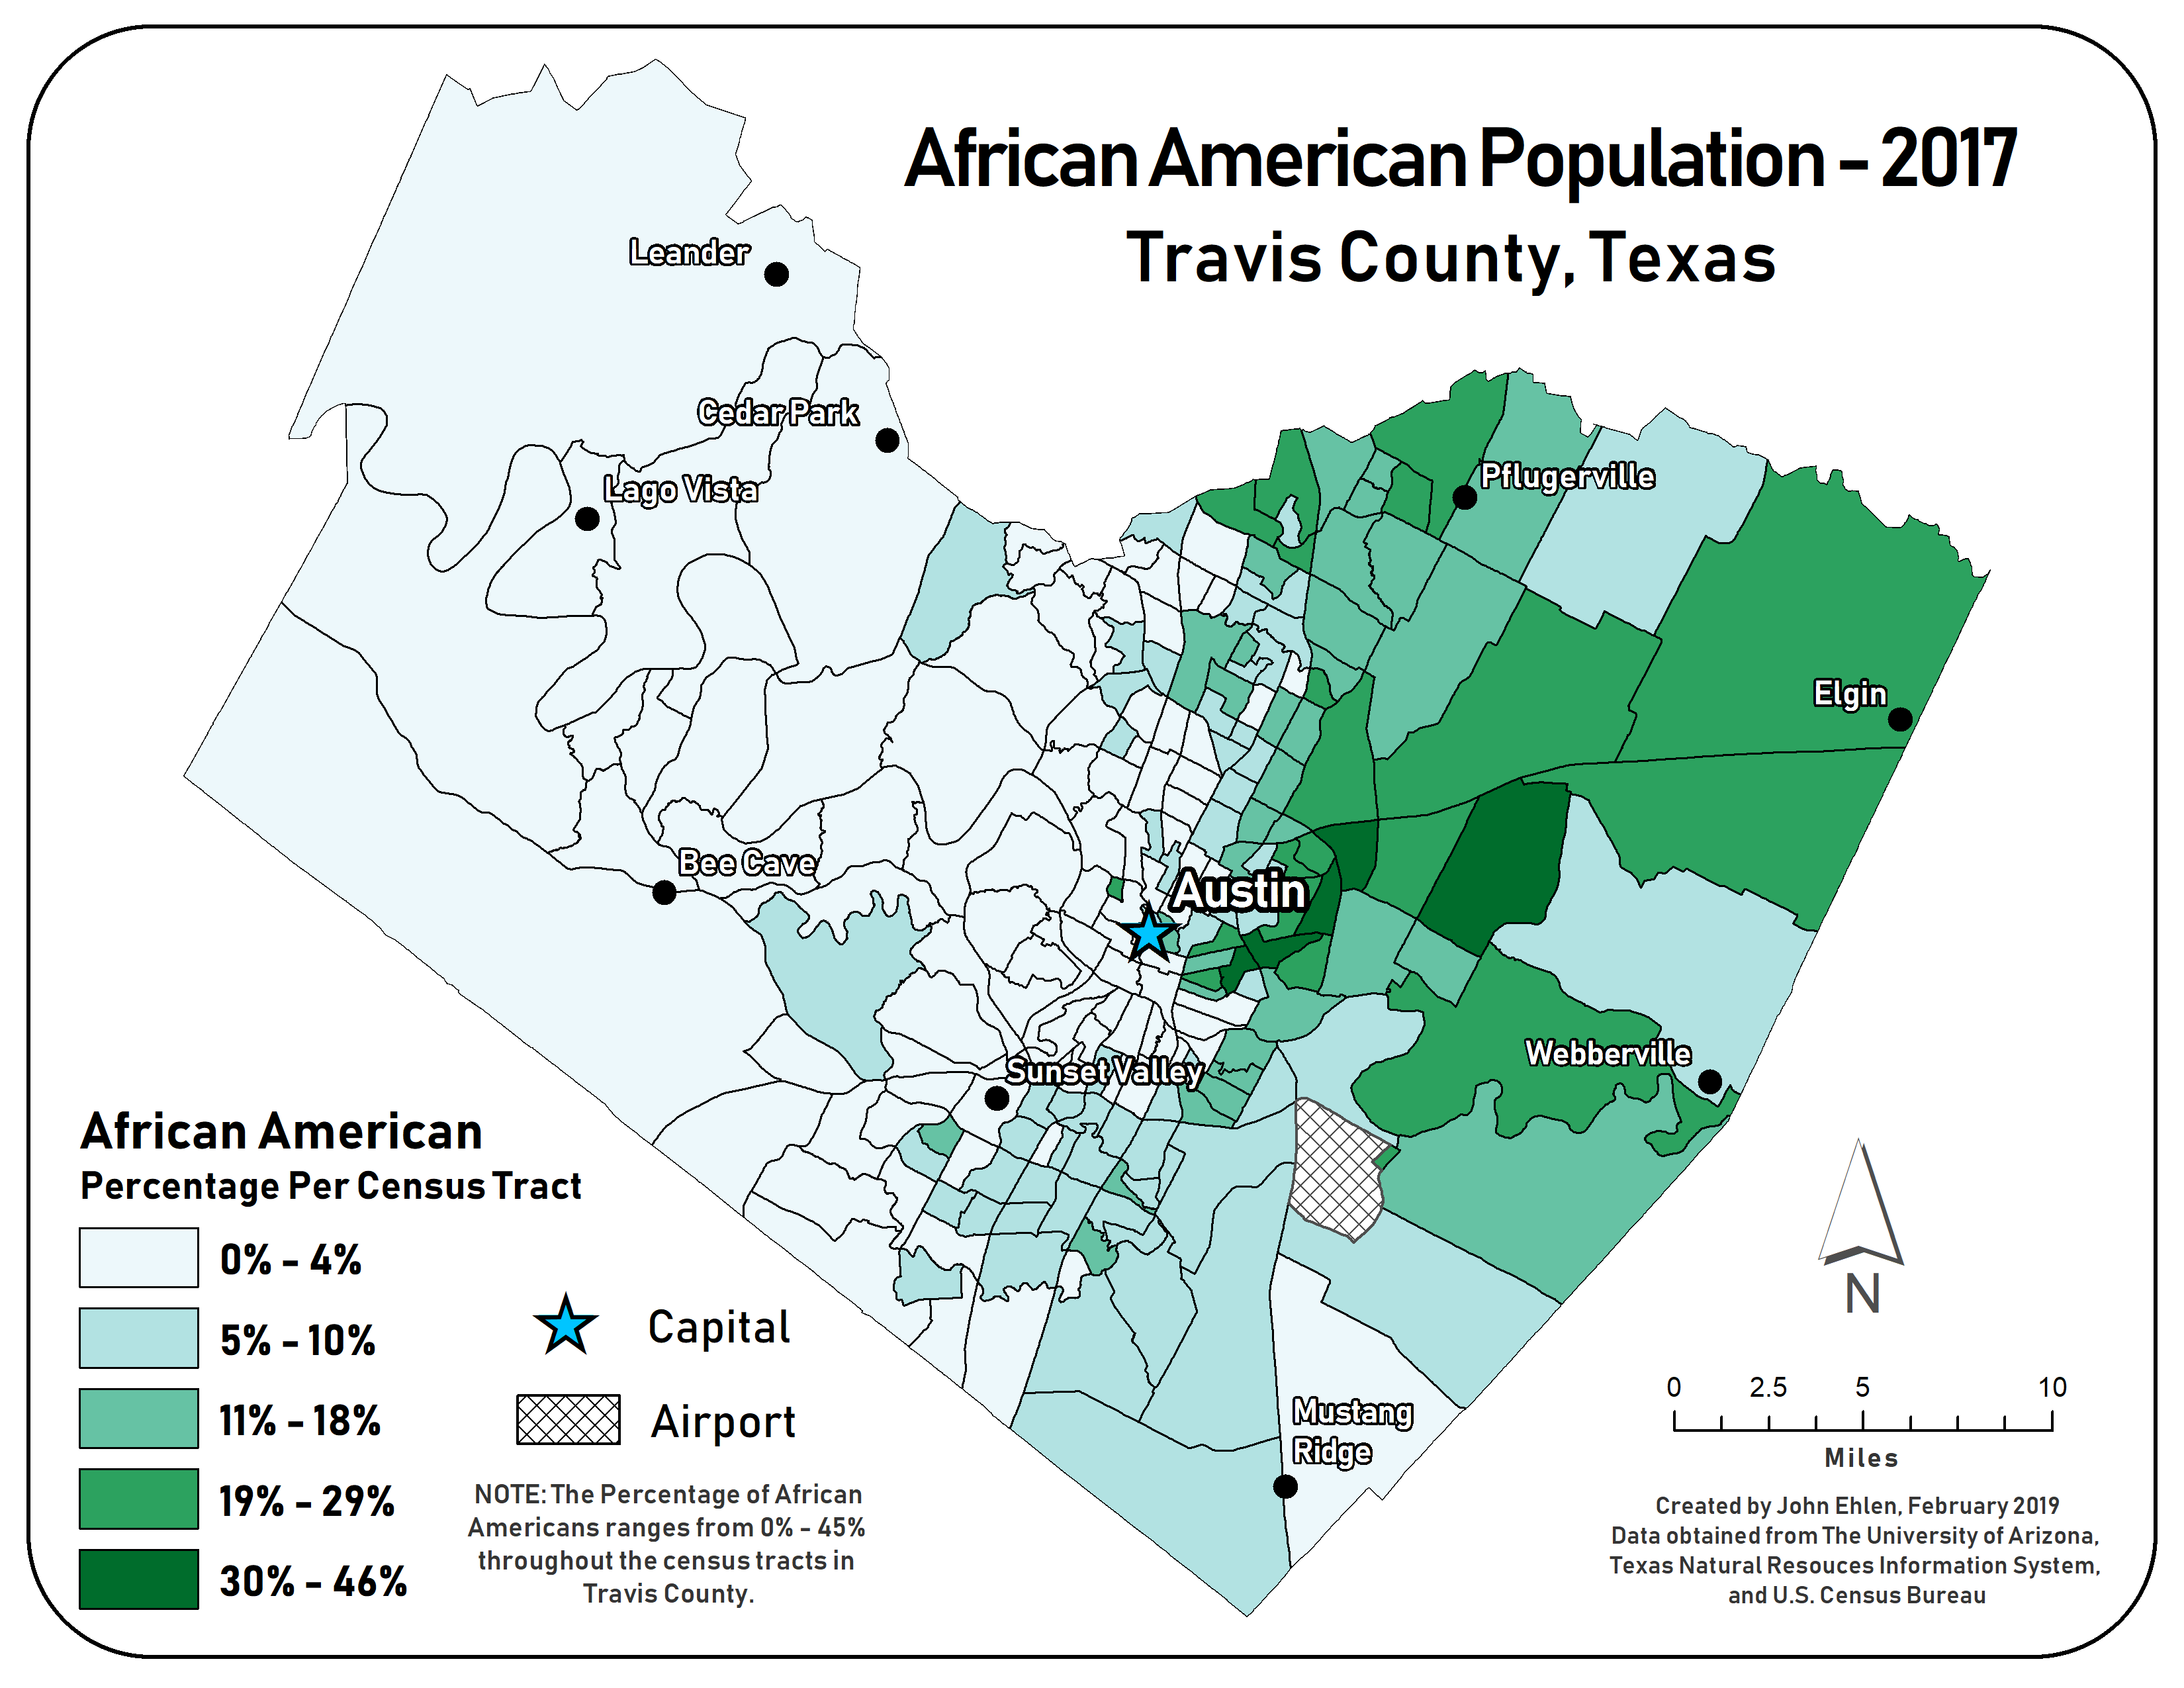
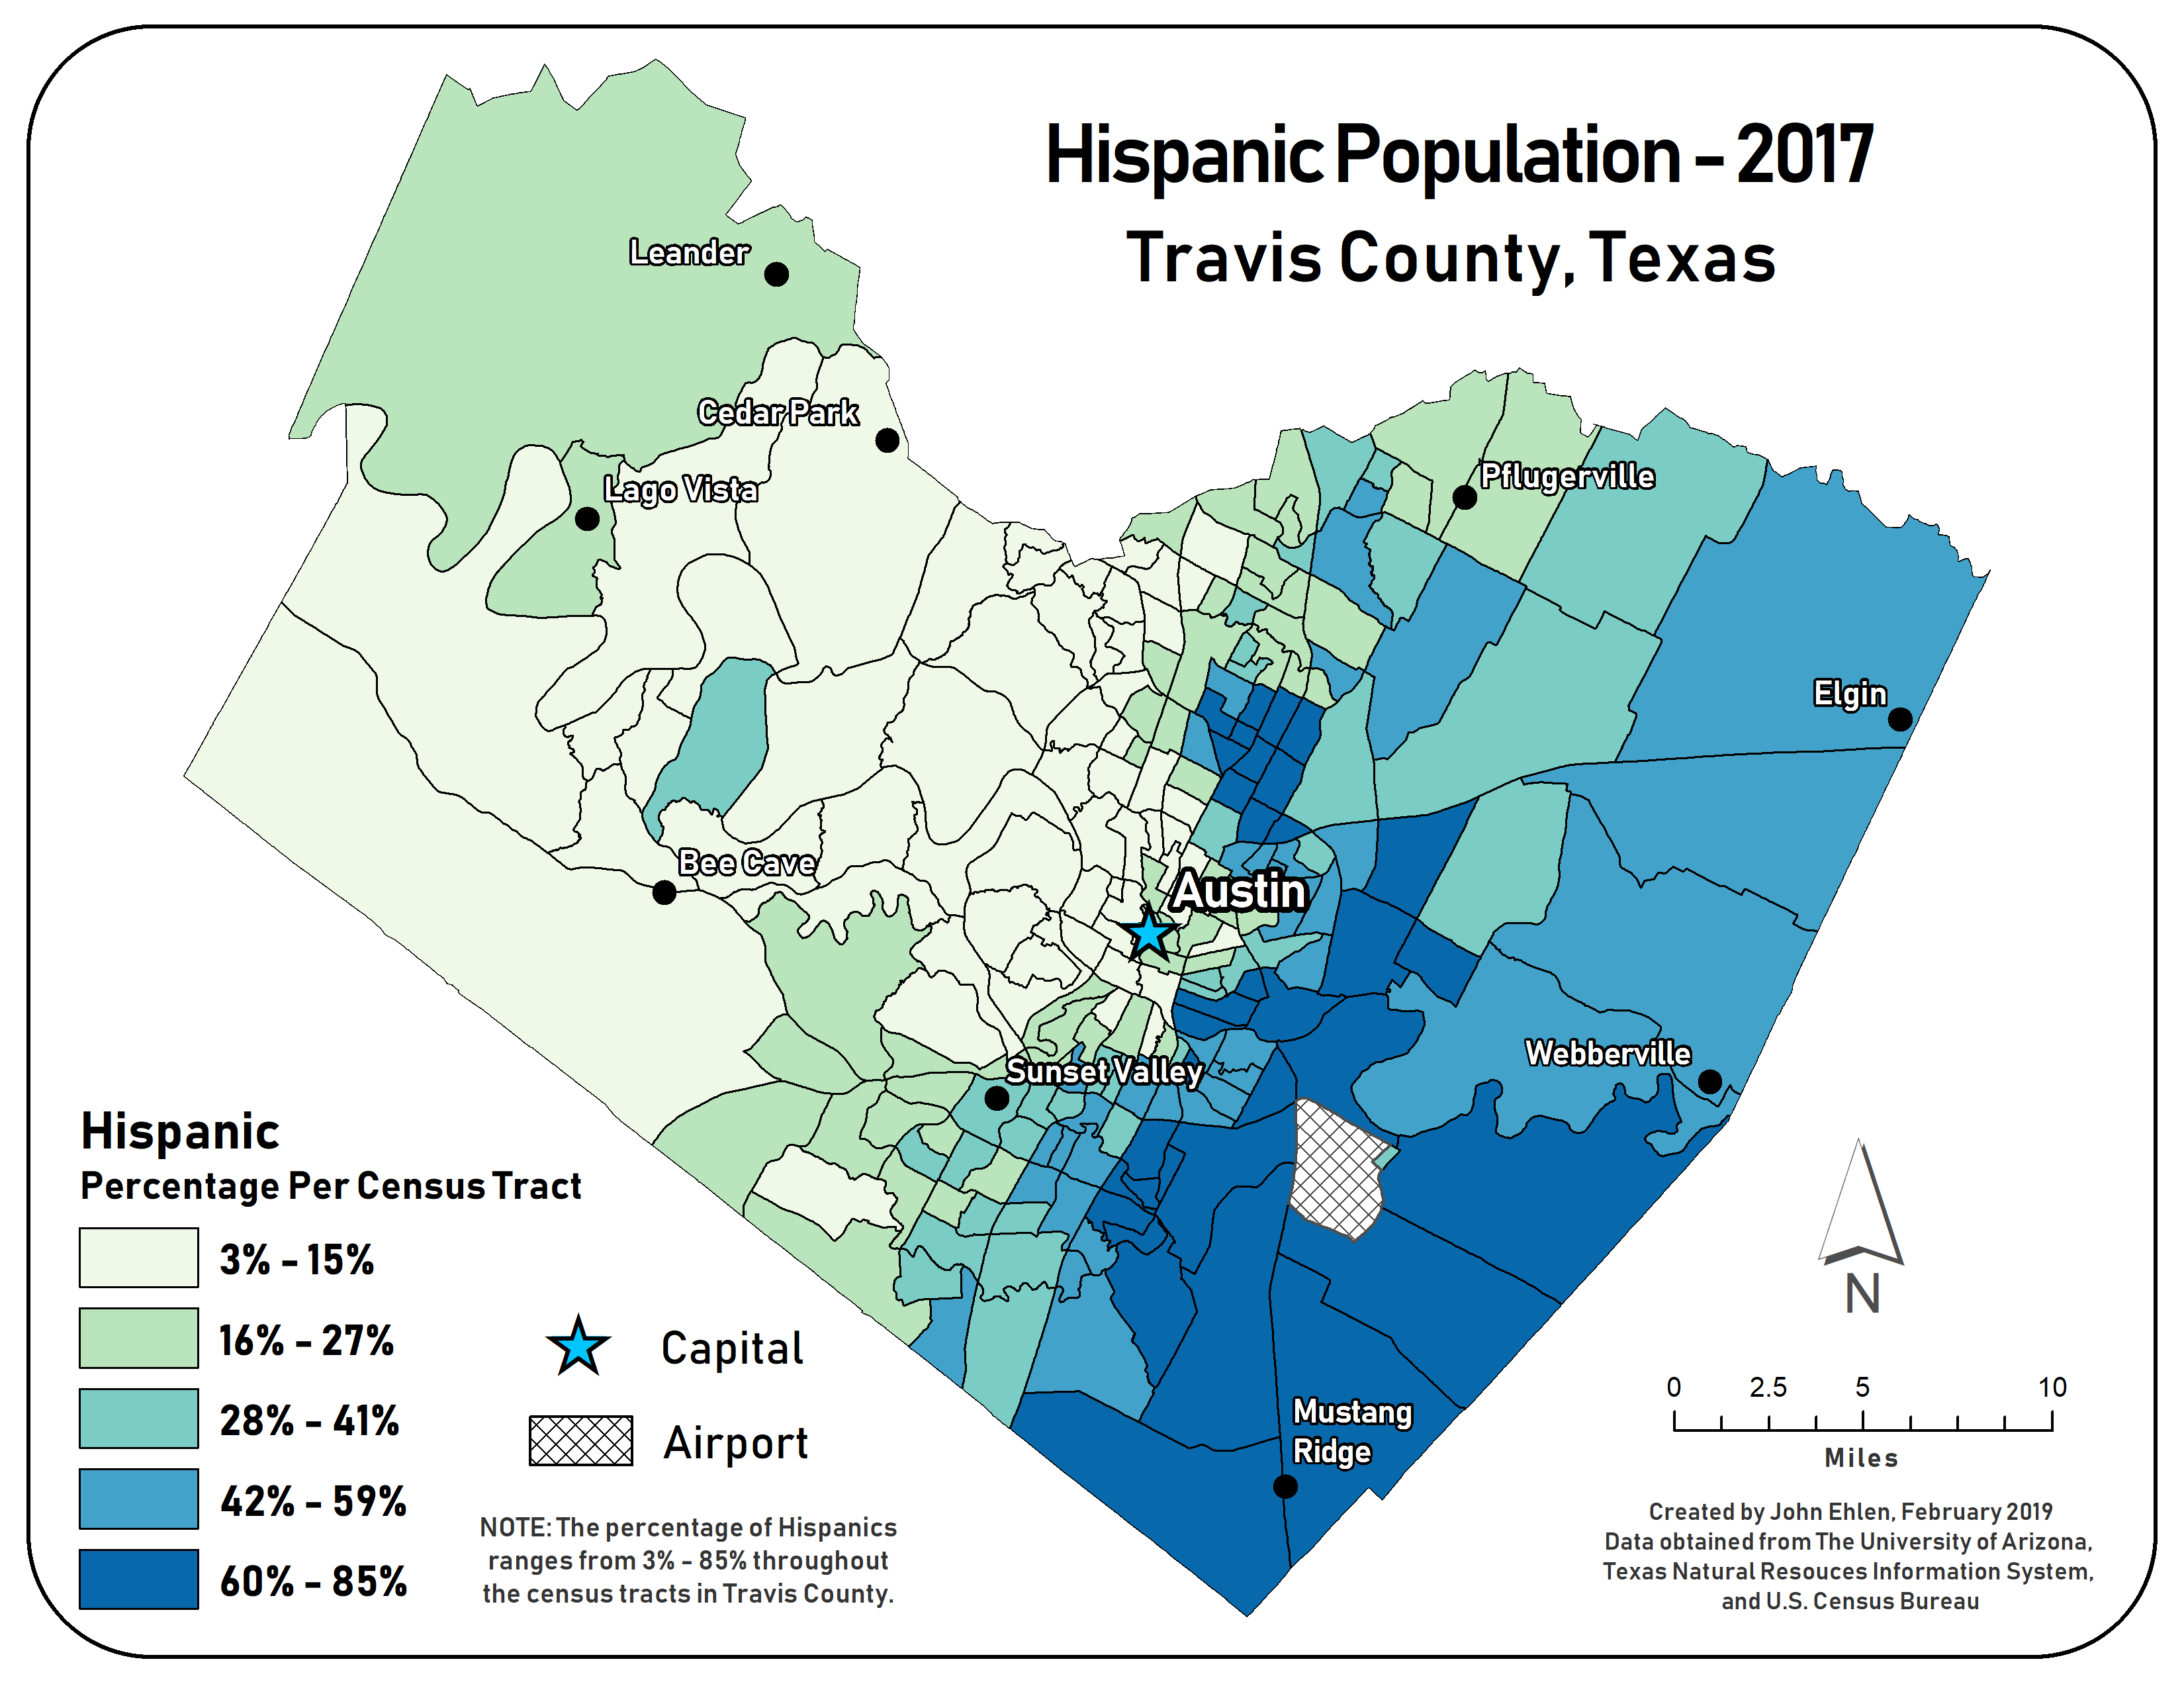
Although no regression analysis was performed comparing the population distribution to pollution, a spatial autocorrelation report was run for each of the 3 racial groups. The reports and maps shown below indicate a very high level of spatial autocorrelation within reported races. Simply put, members of one racial group tend to live nearer to other members of the same racial group, and are less likely to live near members of another racial group. Check out the interactive story map analysis with the link below.
CLICK HERE FOR STORY MAP