The sessions weren’t recorded, so each one is here with its title slide and the full deck.

Resurrecting the State Highway Log
With Sage Donaldson of ADOT: the Gistic Research process that got the logs published again.
The 2021 State Highway System Log in numbers
From ADOT’s 2021 State Highway System Log mileage summaries, as of December 31, 2021: the last edition I helped with. Figures as published.
- 9,414.81
- centerline miles, including ramps and frontage roads
- 30,557.65
- maintained lane miles
- 22,362.67
- travel lane miles
- 124
- routes and route sections
- 3,697.88
- centerline miles on federal, tribal, military and park land
- 15
- counties and 7 districts
| District | Centerline miles | Maintained lane miles |
|---|---|---|
| Central | 1,485.00 | 6,418.76 |
| Northcentral | 1,523.66 | 4,637.44 |
| Northeast | 1,427.64 | 3,954.59 |
| Northwest | 1,369.31 | 4,396.03 |
| Southcentral | 1,506.53 | 4,860.37 |
| Southeast | 1,124.79 | 3,328.37 |
| Southwest | 977.87 | 2,962.10 |
| Total | 9,414.81 | 30,557.66 |

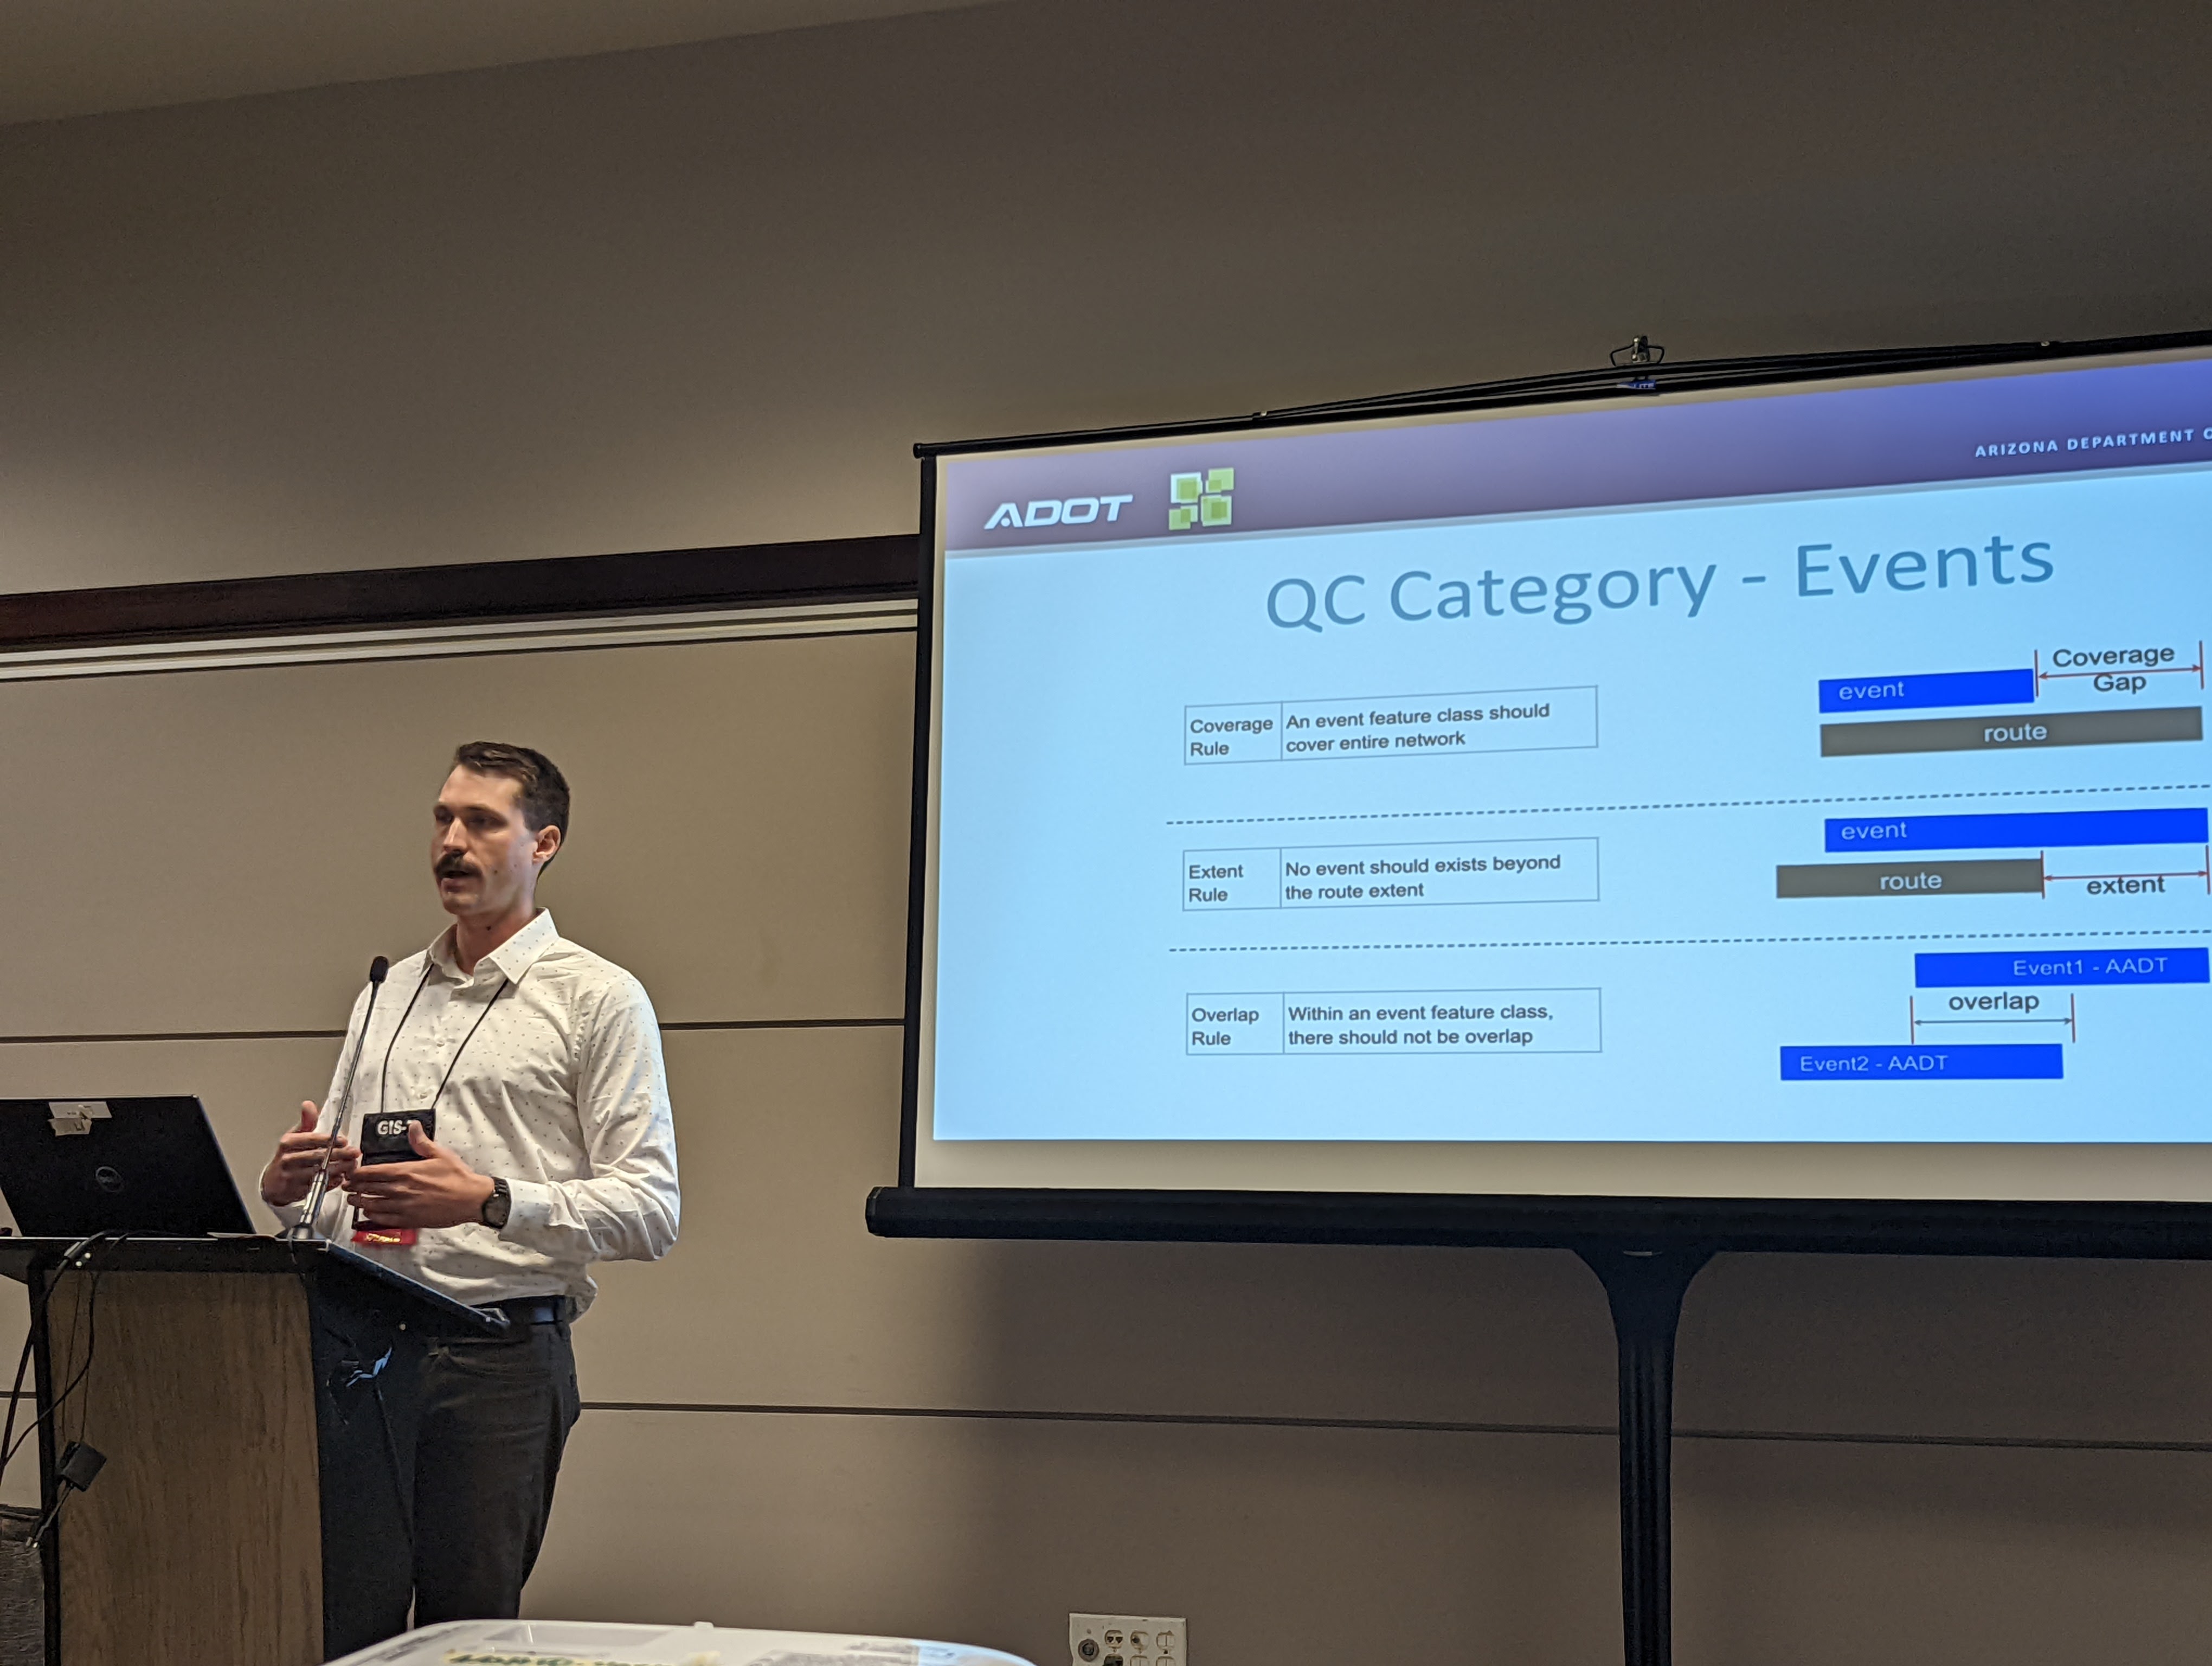
Supporting R&H data production with executive QC dashboards
With Shaun Perfect of ADOT: one dashboard for every domain, LRS event and LRS route error in ADOT’s Roads and Highways data.

From nonspatial events to polygons
A Gistic Research workflow that builds polygon boundaries from nonspatial linear events.
How the polygon workflow runs
Some road records exist only as rows in a table: a route, a start and end measure, and a value. FME turns them into polygons in six steps:
- Convert mileposts to route measures.
- Locate each event on its route to make a line.
- Turn each line into evenly spaced points that keep the event’s value.
- Draw a Voronoi cell around every point.
- Dissolve the cells by value into one polygon each.
- On each run, compare the new polygons with the published ones, retire the ones that changed and add the new.

The dashboards behind the talks
The talks came out of the day-to-day work. As project manager I ran the work behind five dashboards on the state highway system: traffic monitoring (HPMS), structures, the State Highway System detail log, Roads and Highways data QC and pavement condition, which we moved from Tableau to ArcGIS Online.

For the structures data on the linear referencing system, FME ran every hour and wrote an error report for each run.
Downloads
- PDFResurrecting the State Highway Log: 2020 State Highway System Detail Log
- PDFResurrecting the State Highway Log: 2021 State Highway System Log, mileage summaries
- PPTXResurrecting the State Highway Log: Slides
- PPTXSupporting R&H data production with executive QC dashboards: Slides
- PPTXFrom nonspatial events to polygons: Slides