
Projects
Case studies, tools and talks.
Enterprise GIS platforms, data pipelines and applied AI at FilmLA, and earlier statewide transportation and NG911 data work, QA tooling and public dashboards.
Live from GitHub
2,214 contributions
1,353 in the last twelve months, private work included.

Modernizing an enterprise GIS: cloud migration, a major version upgrade and 100+ shared services
FilmLA Modernized a legacy ArcGIS Enterprise deployment: moved it from on-premises servers to the cloud, brought it up to current practice with all code in versioned repositories, carried it through a major version upgrade, and rightsized it to save $30K a year. It serves 100+ map and feature services, holding 150+ feature classes, to GIS and non-GIS departments. Systems & infrastructure / Automation & QA
Data pipelines with custom spatial connectors
FilmLA Pipelines that move data from business applications into Google BigQuery through Hevo, with custom connectors for the spatial data the standard connectors don’t handle. Systems & infrastructure / Automation & QA
A web editor for jurisdiction boundaries, with every version kept
FilmLA Boundary edits used to be a manual merge-and-clip job in ArcGIS Pro. In this browser-based editor, staff pick a jurisdiction, pull up a location feature by its ID, merge it into the boundary or remove it, preview the result and confirm, with the support ticket attached. Written business rules guide the edits, so staff with no ArcGIS Pro experience can make fast, accurate and safe geometry edits. Every change archives the previous version first, and any version can be restored. Systems & infrastructure / Automation & QA
A one-click tunnel manager for Google Cloud VMs
FilmLA A desktop app that replaces a folder of shell scripts and remembered commands with one checkbox per tunnel. It lists only the VMs your Google Cloud permissions allow, opens Identity-Aware Proxy tunnels to them, starts a stopped VM first, and opens a console with the gcloud tools ready for sign-in. One app for connecting, with access secure by default. Systems & infrastructure / Automation & QA
A data pipeline you can run: the USGS earthquake feed
A five-step ETL job that runs on this site’s server when you press Run: it fetches the USGS earthquake feed you choose, reshapes it into a table, validates every record, builds a report and publishes the cleaned data as CSV or GeoJSON. The log shows what each step did and the run’s total server time. Automation & QA / Systems & infrastructure
An NG911 address check with Census geographies
Type any US street address, or use your location, and this site’s server splits it into NENA NG911 civic address fields, checks them against the US Census Bureau’s geocoder, and maps the census tract with its ACS estimates. The kind of address QA I built for statewide NG911 data, in one form. NG911 & addressing / Maps & analysis
Health checks for the services this site depends on
Checks the outside services the other demos depend on, from this site’s server, when you press Run checks: whether each one answers, how long it takes, and which IP address it answered from. Results are cached for a minute, and the history keeps at most one sample every five minutes, the last 48 per service. Systems & infrastructure / Automation & QA
A crawler log: which bots read this site
Every crawler request that reaches WordPress is counted on this site’s server: search engines, AI crawlers and assistants, link previews and SEO tools. Repeats from the same crawler and address to the same page within a minute are rolled into one row with a hit count. The page shows the last 28 days: which crawlers came, what they asked for and when. Ordinary visitors are never logged. Systems & infrastructure
Highway logs, QC dashboards and event polygons
Gistic Research, Inc. Three sessions at the 2022 GIS-T Symposium on statewide road data work for the Arizona Department of Transportation: republishing the State Highway System logs after an eight-year gap, executive QC dashboards for the road network, and turning table-only road records (linear events) into authoritative polygons. Transportation & LRS / Automation & QA Video
A live WZDx work-zone feed from an ArcGIS service
Gistic Research, Inc. Reads New York State DOT’s oversize/overweight permitting data straight from an ArcGIS REST service, converts it to a U.S. DOT Work Zone Data Exchange (WZDx) 4.0 GeoJSON feed, and serves it in real time from an API endpoint. Transportation & LRS / Automation & QA Video
Automated QC for a statewide road network
Gistic Research, Inc. An FME pipeline that validates the Arizona Department of Transportation’s Esri Roads and Highways geodatabase against its own data rules and route-network checks, and feeds a dashboard that shows managers which errors are coming in, how often, from whom and where. Transportation & LRS / Automation & QA
Bulk code review for FME workspaces
An FME workspace that examines hundreds of other FME workspaces at once and writes HTML reports for maintenance and code review: which workspaces read a given feature class, which transformers need upgrading, and which file paths no longer exist. Automation & QA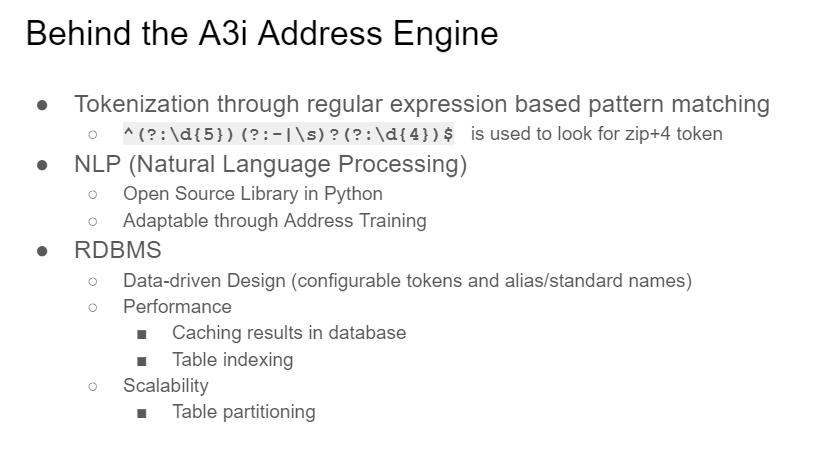 Video
AI-assisted address validation for NG911
Gistic Research, Inc. An address analysis utility for NG911, built by Gistic Research and TSSW, that parses and standardizes addresses with AI and NLP engines, then geocodes and spatially validates them in one pass. I built the Python tool that runs it inside ArcGIS Pro and helped train the parser models. NG911 & addressing / Applied AI / Automation & QA
Finding overlapping address ranges with geometry
Address ranges and LRS measures describe a road network through attributes, so overlaps slip past spatial checks and defeat SQL lag/lead tricks. This method redraws every range as a straight line on a single axis and lets the spatial engine intersect them, finding every overlap at once. NG911 & addressing / Transportation & LRS / Automation & QA
Aerial imagery under FAA Part 107
FAA Part 107 certified remote pilot since August 2021. Aerial and ground photography from around Prescott, Arizona. Maps & analysis
Running a county GIS on about 200 Python scripts
Yavapai County About 200 scheduled Python scripts kept Yavapai County’s GIS current: parcel imports from the assessor, weekly updates from 11 cities and towns, geodatabase maintenance, QA/QC checks and regular exports to 9-1-1, dispatch, the state DOT and an imagery provider. Automation & QA / NG911 & addressing / Systems & infrastructure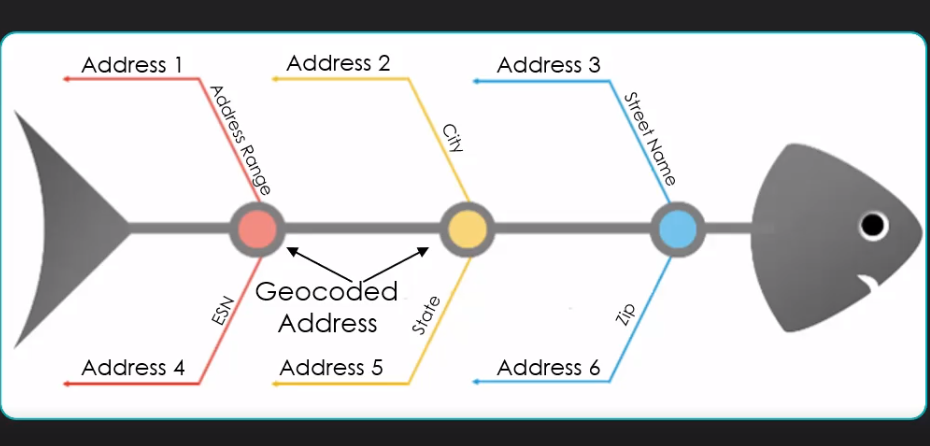 Video
Fishbone analysis: seeing address errors on the map
Yavapai County A QA method that draws a line from every address point to where it geocodes on the road centerline. Clean data draws evenly spaced lines that never cross; range, parity, side-of-street and street-name errors show up as lines that do. NG911 & addressing / Automation & QA
Road centerline QA and change reports
Yavapai County Built during the NG911 rollout, when Yavapai County’s cities and towns began feeding their road data into the county: a Python QA/QC suite for the centerlines, and a change-detection map series that caught segments duplicated, shifted or removed by the nightly integration, emailed out every night with a map package of each segment before and after. NG911 & addressing / Transportation & LRS / Automation & QA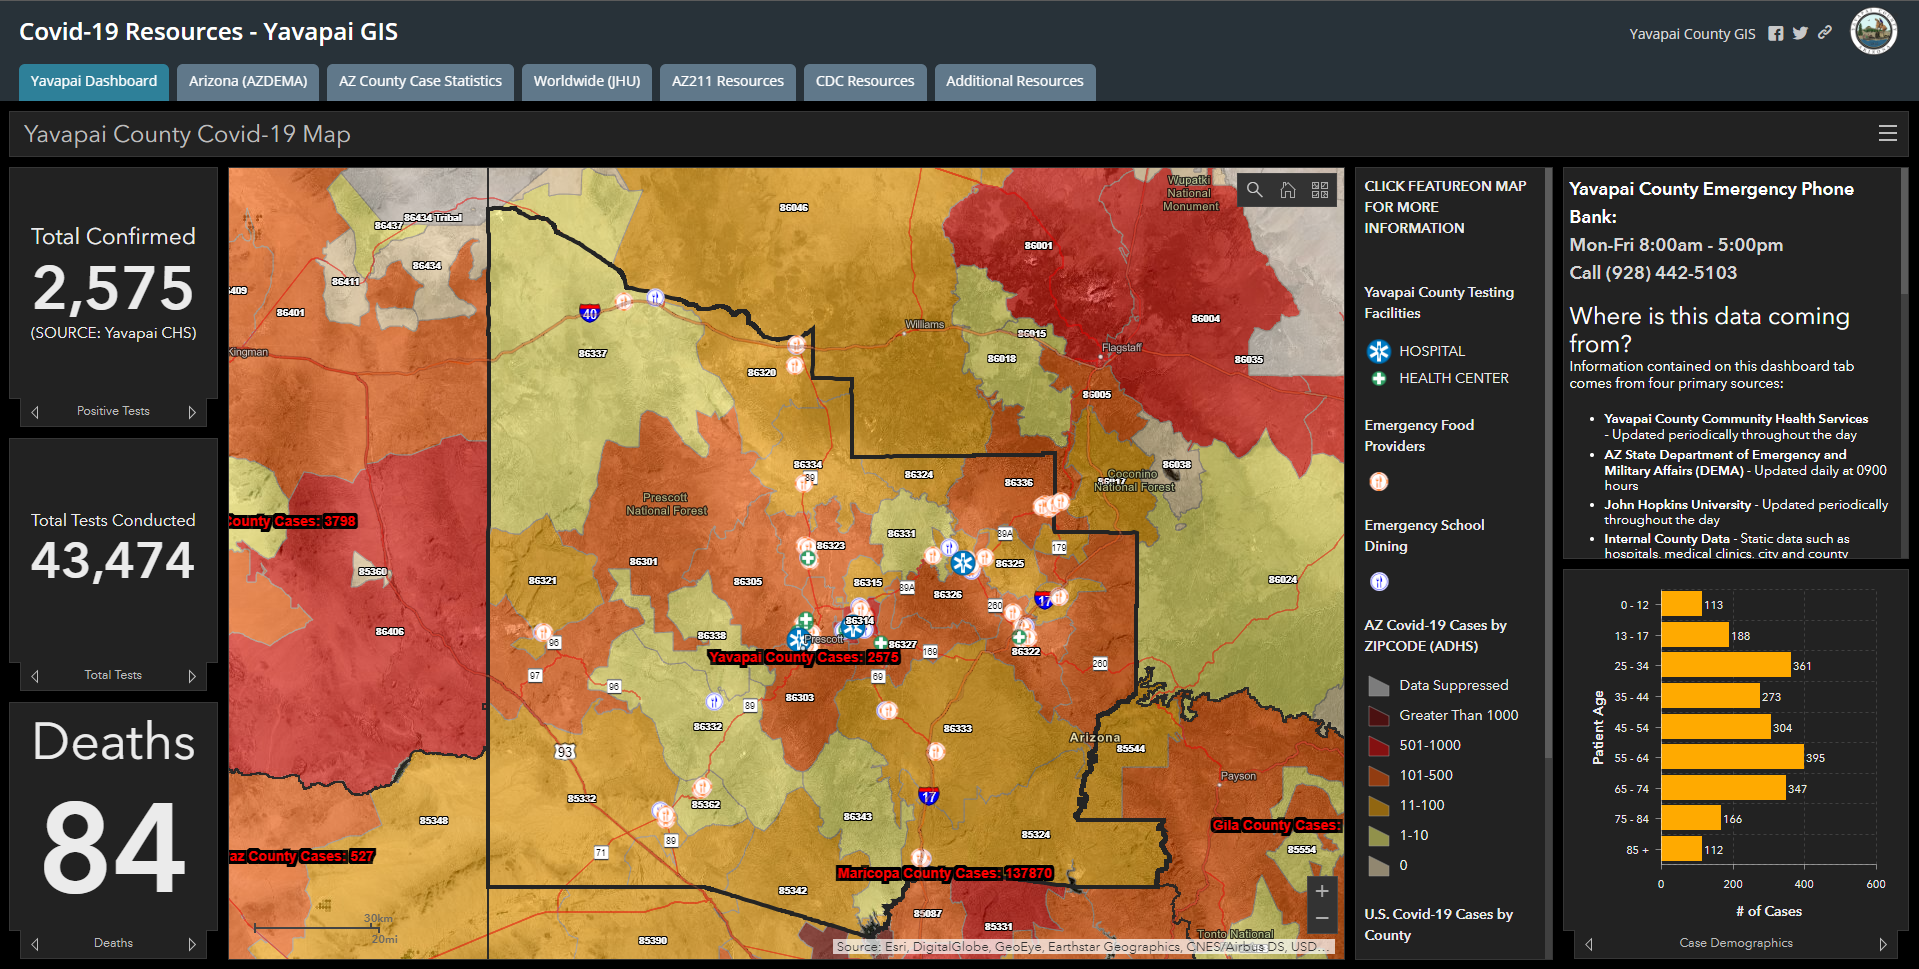
Yavapai County COVID-19 dashboard
Yavapai County The county’s public COVID-19 tracking dashboard, built with the emergency operations center, health department, epidemiologist and county attorney so every figure published stayed within health-privacy rules. Maps & analysis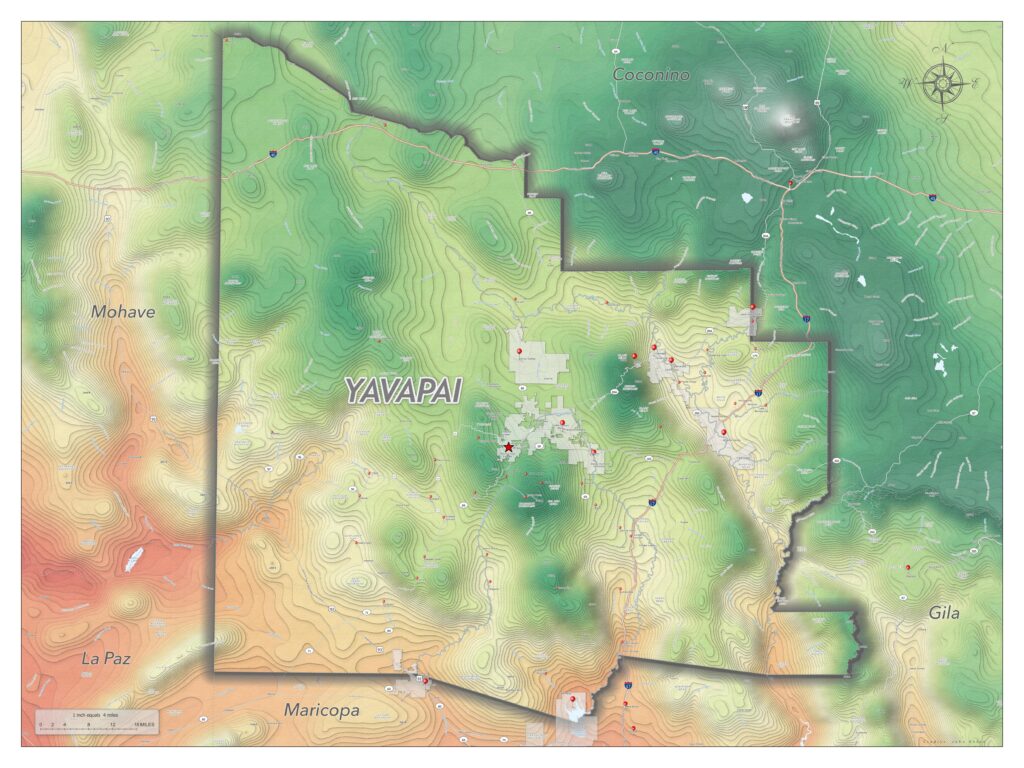
Yavapai County elevation and climate map
A 36 × 48 inch print map of Yavapai County, colored by elevation and average annual temperature: low, hot areas run red, cooler high country runs green, and peaks are white. Maps & analysis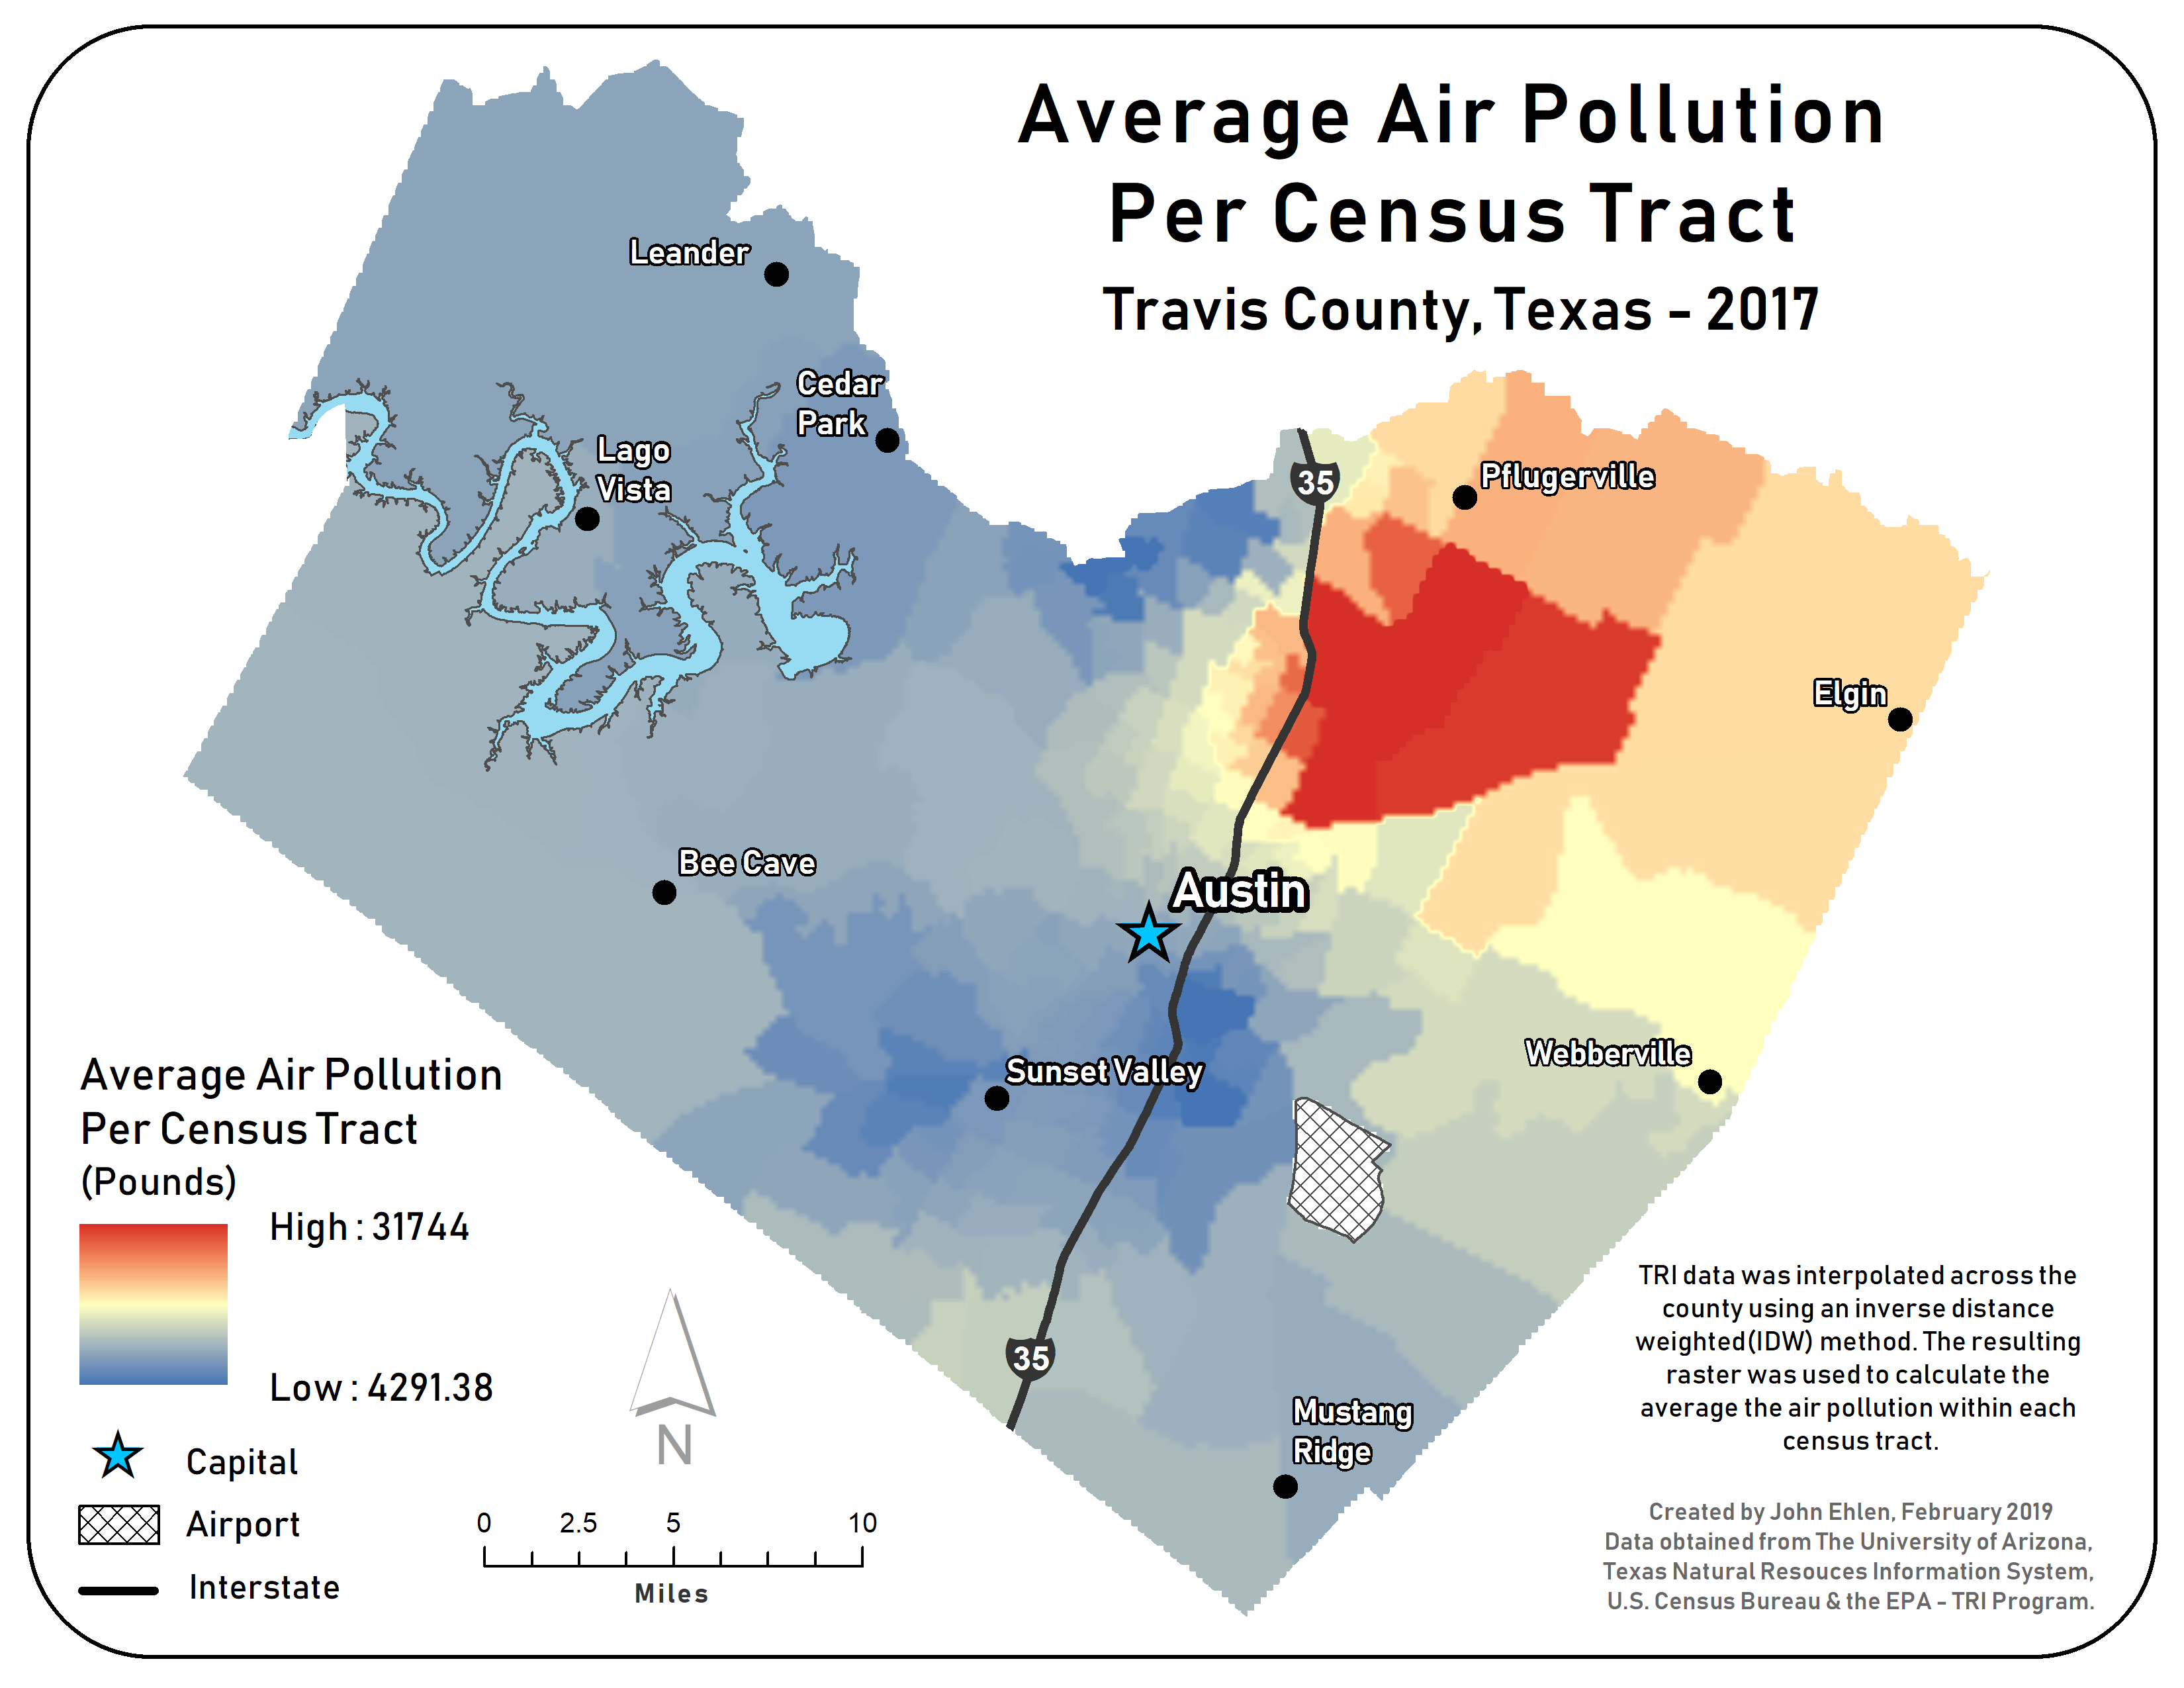
Environmental justice analysis, Travis County, Texas
A study of where major pollution sites from the EPA Toxics Release Inventory sit relative to where people live, by population density and race, with a spatial autocorrelation report for each group. Maps & analysisNothing under that topic yet.